Analysis of Market Trends from Accumulated Graphs
RJ0900034_27
- Last Update 08/26/2025
- File Size 1.8MB
- # of Slides 2
- File Format PPTX
- Slide Ratio 16:9
- Color
Keywords
- #Content-Based Slides
- #Design-Based Slides
- #Financial Plans and Performance
- #Graph
- #Sales and Revenue
- #Horizontal Bar
- #Segmented Horizontal Bar
- #16:9
- #horizontal bar chart PowerPoint
- #bar graph slide template
- #market trend analysis chart
- #multi-series comparison
- #financial data visualization
- #how to create bar chart in PowerPoint
About the Product
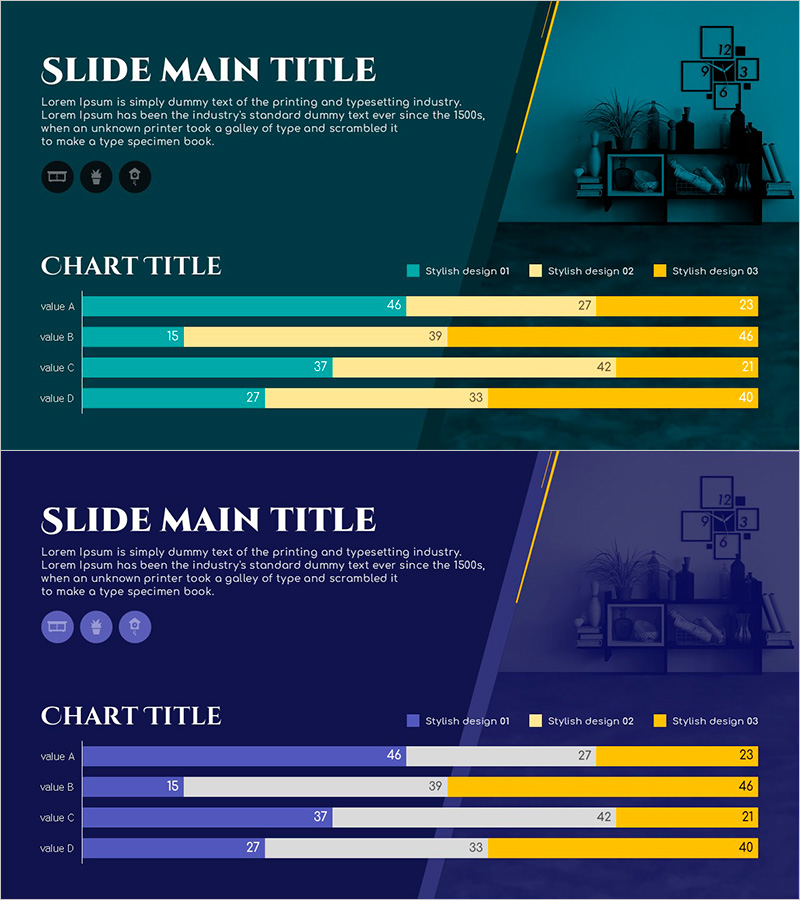
A horizontal bar chart PowerPoint slide optimized for market trend analysis and financial data comparison. This slide structure displays 4 items (Value A through D) with 3 data series simultaneously, making it ideal for comparing multiple metrics such as revenue, profit, and growth rates. The design uses three distinct colors—teal, gold, and yellow—to differentiate each series for visual clarity, with data labels clearly displayed for accurate numerical communication. The 2-slide set provides two design variations: one with a teal background and another with a deep navy background, allowing you to match your presentation's overall tone and aesthetic.
Usage Points
-
Main Usage
Compare multiple metrics—market trends, revenue figures, financial performance—at a glance. The 4-item by 3-series structure enables parallel data representation, making it ideal for executive reports, investor presentations, and quarterly performance reviews.
-
How to Use
Bar length intuitively represents numerical magnitude, while color-coded legend immediately identifies each series. Replace data labels with actual figures and rename items (Value A–D) to your analysis categories (regions, products, quarters, etc.) for quick customization.
-
Recommended For
Executives, finance teams, marketing departments, and sales teams presenting quarterly results, regional revenue, product-line performance, or competitive analysis. Particularly effective when comparing three or more metrics simultaneously across multiple categories.
-
Slide Structure
Slide 1 (teal background): 4-item × 3-series horizontal bar chart with legend and title area / Slide 2 (navy background): identical structure in alternative design. Each bar includes numerical labels; series are clearly distinguished by color (teal, gold, yellow).
Related Products
-

Horizontal Bar Chart Slide | Data Comparison & Analysis PPT
#Business Strategy #Financial Plans and Performance #Graph
-

Sales and Profit Calculation Graph – Financial Performance at a Glance
#Market and Competitor Analysis #Financial Plans and Performance #Graph
-

Visualizing Menu Sales Trends with Horizontal Bar Graph
#Market and Competitor Analysis #Financial Plans and Performance #Graph
-

Sales Outlook Analysis Table – Focus on Market and Financial Performance
#Market and Competitor Analysis #Financial Plans and Performance #Diagram
