Visualizing Menu Sales Trends with Horizontal Bar Graph
RJ0600077_16
- Last Update 07/10/2025
- File Size 6.3MB
- # of Slides 2
- File Format PPTX
- Slide Ratio 16:9
- Color
Keywords
- #Content-Based Slides
- #Design-Based Slides
- #Market and Competitor Analysis
- #Financial Plans and Performance
- #Graph
- #Customer Analysis
- #Sales and Revenue
- #Horizontal Bar
- #Segmented Horizontal Bar
- #16:9
- #horizontal bar chart PowerPoint
- #bar graph slide template
- #sales trends visualization
- #data comparison chart
- #business analytics PowerPoint slide
About the Product
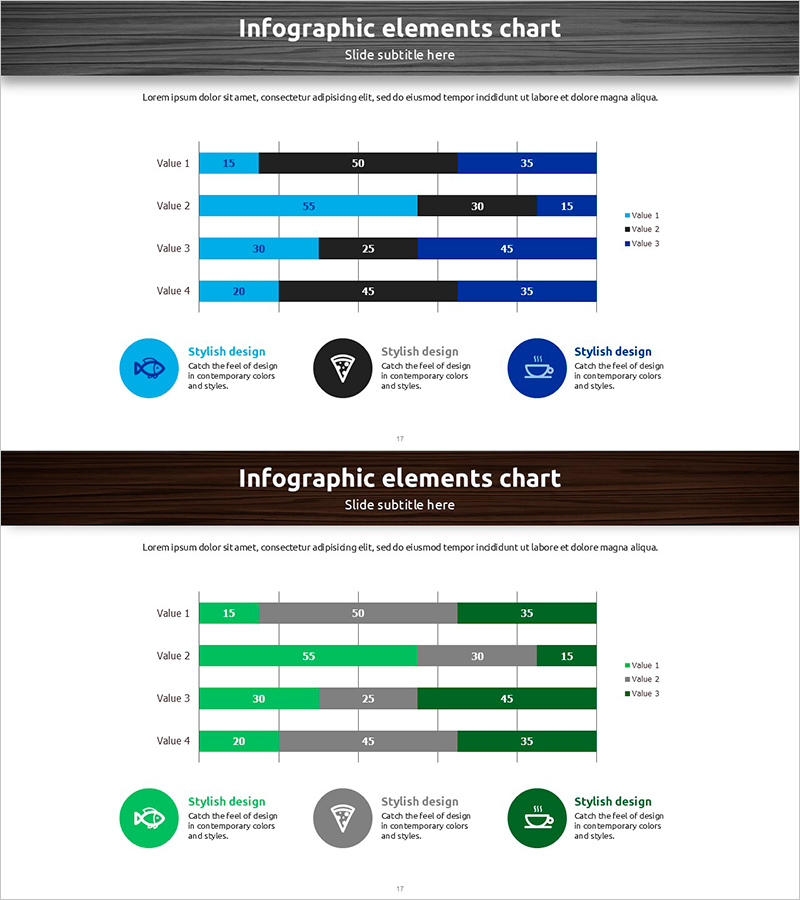
A horizontal bar chart PowerPoint slide for comparing menu sales trends across multiple data series. This presentation template visualizes four items with three distinct data values (Value 1, 2, 3) using color-coded bars in light gray, black, and blue tones for clear numerical comparison. Each bar includes data labels for immediate readability in business presentations. Ideal for sales reports, market analysis, financial performance reviews, and customer analytics in professional PowerPoint decks.
Usage Points
-
Main Usage
Compare four items across three data series (Value 1, 2, 3) using horizontal bar visualization. This chart structure enables clear side-by-side comparison of complex multi-dimensional data, making it ideal for presenting sales performance, market share, or customer preference analysis in business presentations.
-
How to Use
Insert this slide into sales reports, market analysis presentations, financial performance reviews, or customer segmentation decks. Replace sample data with your actual figures, and the bar lengths and labels automatically adjust. Suitable for executive briefings, client pitches, and team performance meetings.
-
Recommended For
Sales managers, marketing professionals, financial analysts, and business consultants presenting comparative data to executives, clients, or team members. Particularly effective for menu performance analysis, product comparison, regional sales breakdown, or time-period trend analysis.
-
Slide Structure
Two-slide template: Slide 1 features light gray background with blue, black, and light blue bars for four items; Slide 2 uses dark wood background with green, gray, and dark green bars. Both include legend, data labels, and text area for descriptions or insights.
Related Products
-

Market Trends Visualized with Stacked Graph – Sales Performance and Competitive Analysis
#Market and Competitor Analysis #Financial Plans and Performance #Graph
-

Mixed Charts and Customer Analysis – Visualizing Customer Insights
#Market and Competitor Analysis #Financial Plans and Performance #Graph
-

Bundled Vertical Bar Graph Blue Green – Market and Customer Analysis
#Market and Competitor Analysis #Financial Plans and Performance #Graph
-

Male-Female Ratio Graph Chart – Essential Tool for Customer Analysis
#Market and Competitor Analysis #Graph #Customer Analysis
