Analysis of the Causes of the Rise and Fall in Sales Slide
RJ0900034_26
- Last Update 08/26/2025
- File Size 1.4MB
- # of Slides 2
- File Format PPTX
- Slide Ratio 16:9
- Color
Keywords
- #Content-Based Slides
- #Design-Based Slides
- #Operational Plan
- #Market and Competitor Analysis
- #Graph
- #Other
- #Mitigation Measures
- #Market Analysis
- #16:9
- #sales analysis PowerPoint slide
- #cause analysis pie chart
- #sales performance PPT
- #market analysis presentation
- #how to create sales comparison in PowerPoint
About the Product
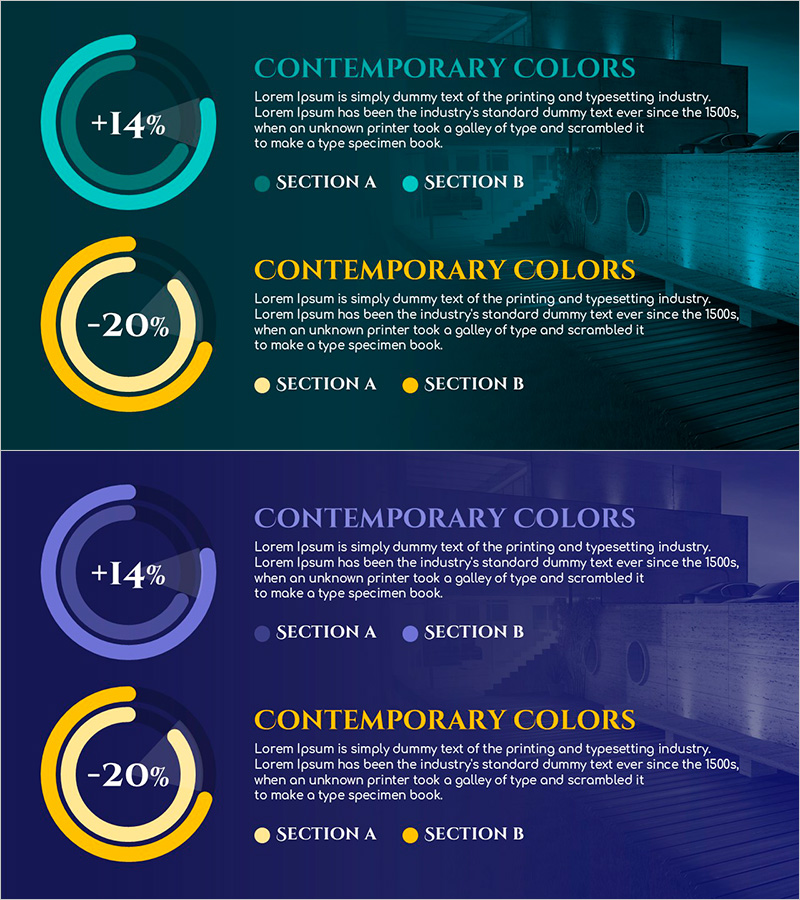
A 2-slide PowerPoint presentation analyzing the causes of sales increases and decreases through visual comparison. The design features cyan and golden pie charts positioned side-by-side to clearly distinguish positive and negative factors. Each slide includes Section A and B labels to emphasize the comparative analysis structure, with bright chart elements contrasting against a dark background. This presentation template is ready to use for marketing strategy development, operational planning, and competitive analysis presentations.
Usage Points
-
Main Usage
This slide deck presents the root causes of sales fluctuations through data-driven analysis and visual communication to executives and team members. The pie chart ratios and percentage figures quantify the impact of each factor, serving as evidence for strategic decision-making.
-
How to Use
Insert these slides into business reports, marketing plans, and operational presentations within the market analysis section. Replace placeholder text with actual sales data and analysis findings, then update chart values to match your presentation narrative.
-
Recommended For
Marketing managers, business planning teams, financial analysts, and executives responsible for quarterly and annual sales reporting. Particularly effective for explaining performance decline causes, justifying strategy adjustments, and investor communications.
-
Slide Structure
The 2-slide layout includes one title area, one pie chart, two section labels, and one descriptive text field per slide. Optimized for 16:9 widescreen format with fully editable chart data and legend elements for customization.
Related Products
-

A Chart for the Total Population – Effective Market Analysis
#Market and Competitor Analysis #Diagram #Graph
-

STP Strategy Positioning Map – Market Analysis and Marketing Plan
#Market and Competitor Analysis #Marketing Plan and Strategy #Graph
-

Market Share Analysis of European Countries – Insights for Market Analysis
#Market and Competitor Analysis #Graph #Other
-

Analysis of US Target Regions – Slide Template for Market and Competitor Analysis
#Market and Competitor Analysis #Graph #Other
