Petcare Area Chart – Visualizing Market Analysis
RJ0800040_12
- Last Update 08/11/2025
- File Size 0.4MB
- # of Slides 2
- File Format PPTX
- Slide Ratio 16:9
- Color
Keywords
About the Product
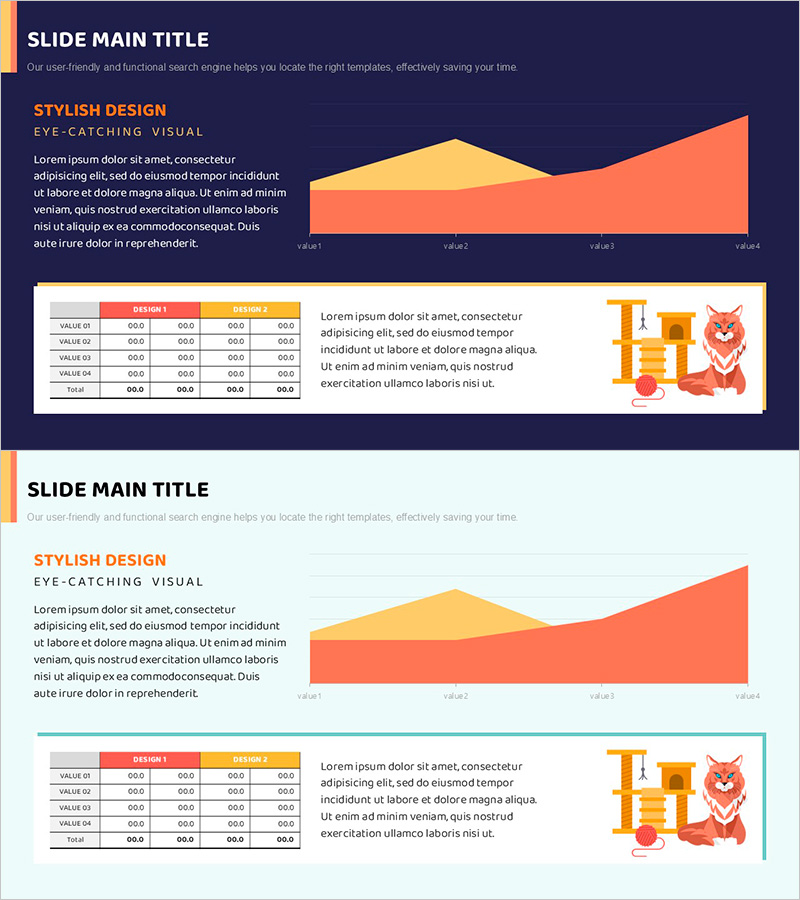
This slide features an area chart visualizing data on the petcare market. The top section displays market trends at a glance, while the bottom part includes a detailed data table. The harmonious use of red and yellow creates a striking visual impact that captures the audience's attention. It is especially suitable for competitor analysis and market reports. The slide is designed for easy replacement of text and charts, with an editing difficulty rated as 'easy'.
Usage Points
-
Main Usage
- This template is ideal for presenting insights into the petcare market during business strategy meetings, allowing stakeholders to grasp essential trends.
-
How to Use
- Utilize this slide during competitor analysis sessions to highlight key market dynamics and facilitate informed decision-making among team members.
-
Recommended For
- This template is beneficial for market analysts, business strategists, and team leaders aiming to communicate findings in internal reports or presentations.
-
Slide Structure
- The design includes a top segment for quick visual trends and a detailed table below to support data-driven discussions, providing a comprehensive overview.
Related Products
-

Office Supplies Theme Area Graph – Market Analysis and Competitor Comparison
#Market and Competitor Analysis #Graph #Other
-

In-Depth Analysis Graph Chart – Optimized for Market and Competitor Analysis
#Market and Competitor Analysis #Graph #Other
-

Visualizing Bar Graphs with PC Mockups – Competitive Market Analysis Tool
#Market and Competitor Analysis #Graph #Other
-

Spaceship Launch Analysis Graph – Ideal for Competitor Analysis
#Market and Competitor Analysis #Diagram #Graph
