Key Messages on a Vertical Cumulative Chart
RJ0900034_21
- Last Update 08/26/2025
- File Size 0.3MB
- # of Slides 2
- File Format PPTX
- Slide Ratio 16:9
- Color
Keywords
- #Content-Based Slides
- #Design-Based Slides
- #Business Vision and Strategy
- #Market and Competitor Analysis
- #Diagram
- #Graph
- #Business Vision
- #Industry Trends
- #Cluster
- #Column
- #Inclusive Cluster Diagram
- #Segmented Column
- #16:9
- #vertical stacked bar chart PowerPoint
- #stacked chart slide template
- #data comparison graph
- #business data visualization
- #3-series bar chart
- #how to create stacked bar chart in PowerPoint
About the Product
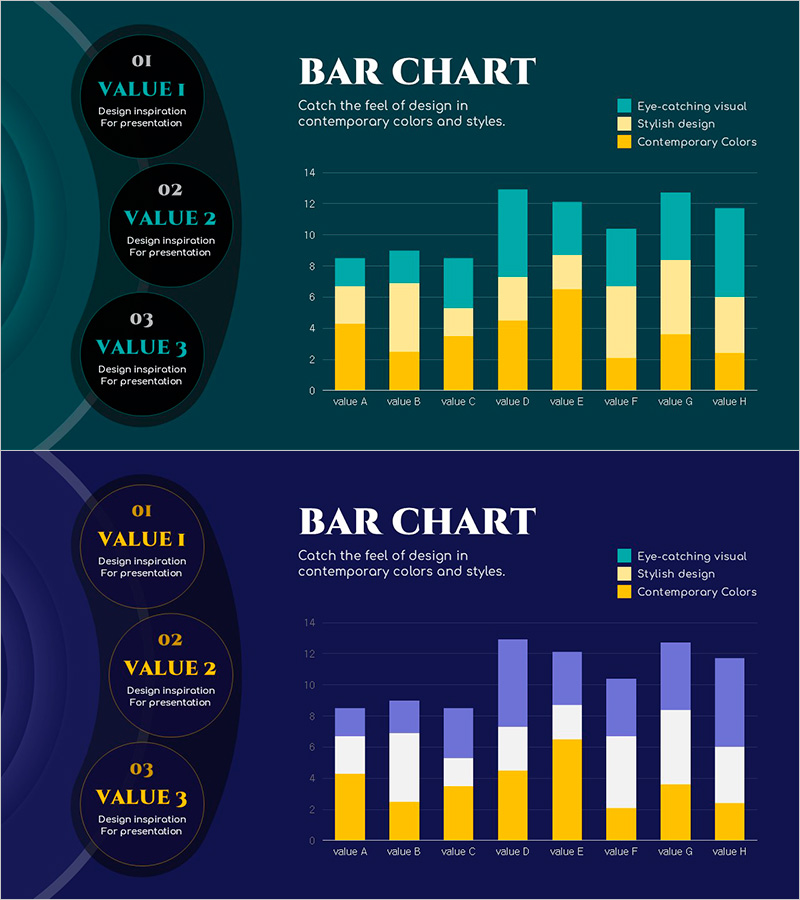
A PowerPoint slide template featuring a vertical stacked bar chart that visualizes three data series across eight categories. The left side displays three circular callout boxes highlighting key messages, while the right side presents the stacked bar chart in teal, yellow, and white color series. This design effectively separates data layers and is ideal for business reports, strategy presentations, and financial analyses where you need to show market trends, business performance, or cost structures. The template includes two slide variations with teal and navy backgrounds, both in 16:9 PPTX format for immediate editing and customization.
Usage Points
-
Main Usage
Displays multiple data series in stacked format to show both total magnitude and compositional breakdown simultaneously. Three circular callout boxes on the left guide interpretation of the chart, allowing presenters to emphasize key insights aligned with their narrative flow.
-
How to Use
Apply this template to quarterly business reports, market analysis presentations, financial statements showing cost allocation, and strategic planning documents. The color-coded bars and stacked structure help audiences quickly grasp data hierarchy and comparative relationships between categories.
-
Recommended For
Finance, planning, marketing, and sales professionals presenting to executives, clients, or investors. Particularly effective for quarterly earnings reports, market sizing discussions, budget allocation explanations, and competitive analysis presentations where numerical credibility is essential.
-
Slide Structure
Slide 1 (teal background): Three circular callout boxes on left (VALUE 1, 2, 3), vertical stacked bar chart on right with 8 categories and 3 color series (teal, yellow, white). Slide 2 (navy background): Identical layout with navy background. Both slides include title, legend, and axis labels in 16:9 aspect ratio.
Related Products
-

Analysis Graph for Child – Market Trends
#Business Introduction #Market and Competitor Analysis #Graph
-

Segment Chart for Market Trends – Green Orange Theme
#Market and Competitor Analysis #Diagram #Graph
-

Granular Numerical Highlight Chart for Market Trends
#Market and Competitor Analysis #Graph #Industry Trends
-

Business Trend Graph by Year – Market Analysis Insight
#Market and Competitor Analysis #Financial Plans and Performance #Diagram
