Segment Chart for Market Trends – Green Orange Theme
RJ0500026_22
- Last Update 06/14/2025
- File Size 0.3MB
- # of Slides 2
- File Format PPTX
- Slide Ratio 16:9
- Color
Keywords
- #Content-Based Slides
- #Design-Based Slides
- #Market and Competitor Analysis
- #Diagram
- #Graph
- #Industry Trends
- #Table
- #Column
- #Standard Table
- #Segmented Column
- #16:9
- #segment chart PowerPoint
- #stacked bar graph template
- #market analysis slide
- #3-series data visualization
- #competitive analysis chart
- #PowerPoint graph slide download
About the Product
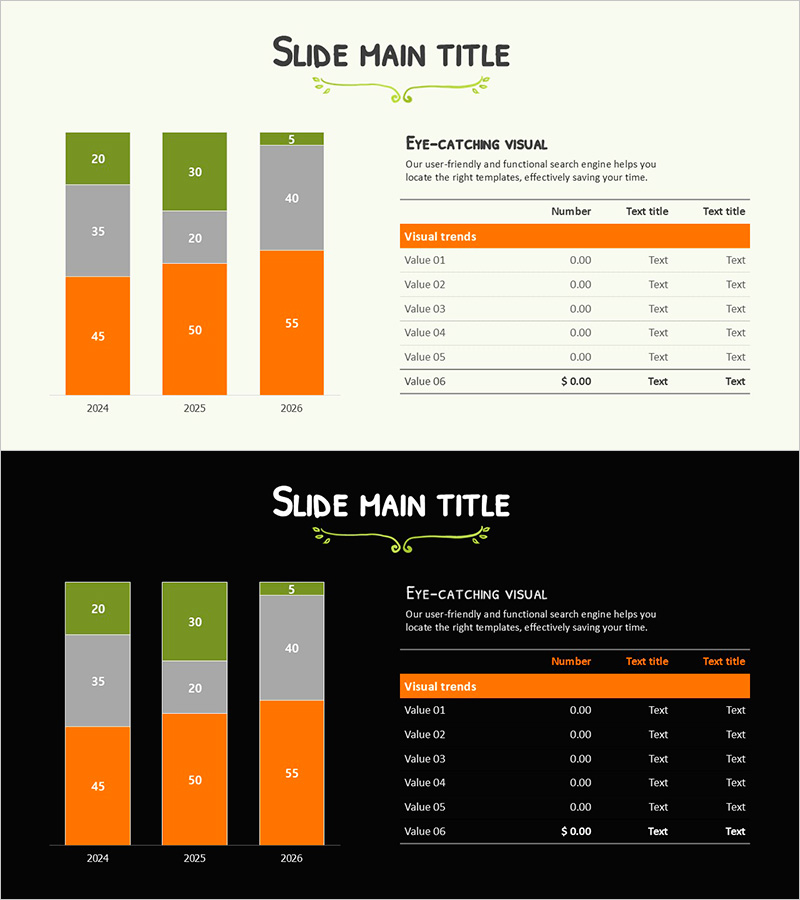
A three-series segment chart PowerPoint slide designed for market trend analysis and competitive benchmarking. The vertical bar graph uses bright green, gray, and vibrant orange colors to clearly visualize data changes from 2024 to 2026. Each year displays three comparable data points, with an accompanying data table on the right side for precise information delivery. This presentation template is ready to use in business reports, strategic plans, pitch decks, and executive presentations.
Usage Points
-
Main Usage
A data visualization slide for year-over-year and item-by-item numerical comparison and market trend analysis. The three-series segment chart enables simultaneous expression of multiple indicators, supporting multi-layered data interpretation such as competitor performance comparison, market share analysis, and quarterly performance trends.
-
How to Use
Input actual figures into the left vertical bar graph and modify the 'Value' items in the right data table. Maintain the year labels (2024–2026) and color scheme (green, gray, orange) to ensure consistent brand messaging. Edit the title and subtitle areas to customize the slide for your presentation context.
-
Recommended For
Marketing managers, executives, consultants, and financial analysts benefit from this template when creating market analysis reports, quarterly earnings presentations, competitive strategy plans, and investor relations materials. It is particularly effective for management meetings and client presentations requiring multi-indicator comparison.
-
Slide Structure
Title area at top, three-series vertical bar graph on the left (3 years: 2024, 2025, 2026 with 3 data points per year), and 6-row data table on the right (columns: Number, Text title, Text title). Two design versions included: light background and black background.
Related Products
-

Hologram Wide PPT Table & Segmentation Bar Graph – Trendy Data Visualization
#Market and Competitor Analysis #Financial Plans and Performance #Diagram
-

Market Growth Chart for Business Insights
#Market and Competitor Analysis #Diagram #Graph
-

Business Trend Graph by Year – Market Analysis Insight
#Market and Competitor Analysis #Financial Plans and Performance #Diagram
-

Red Green Market Analysis Slide – Effective Data Visualization
#Business Strategy #Market and Competitor Analysis #Diagram
