Production & Technology Development Strategy – 3 Step Flowchart
RM0100002_20
- Last Update 01/24/2025
- File Size 0.4MB
- # of Slides 2
- File Format PPTX
- Slide Ratio 16:9
- Color
Keywords
- #Content-Based Slides
- #Design-Based Slides
- #Business Strategy
- #Marketing Plan and Strategy
- #Diagram
- #Step-by-Step Schedule Plan
- #Marketing Strategy
- #Flow
- #Linear Flow
- #16:9
- #3-step flowchart PowerPoint
- #linear diagram slide template
- #production technology strategy presentation
- #phase timeline chart
- #process flow PowerPoint slide design
About the Product
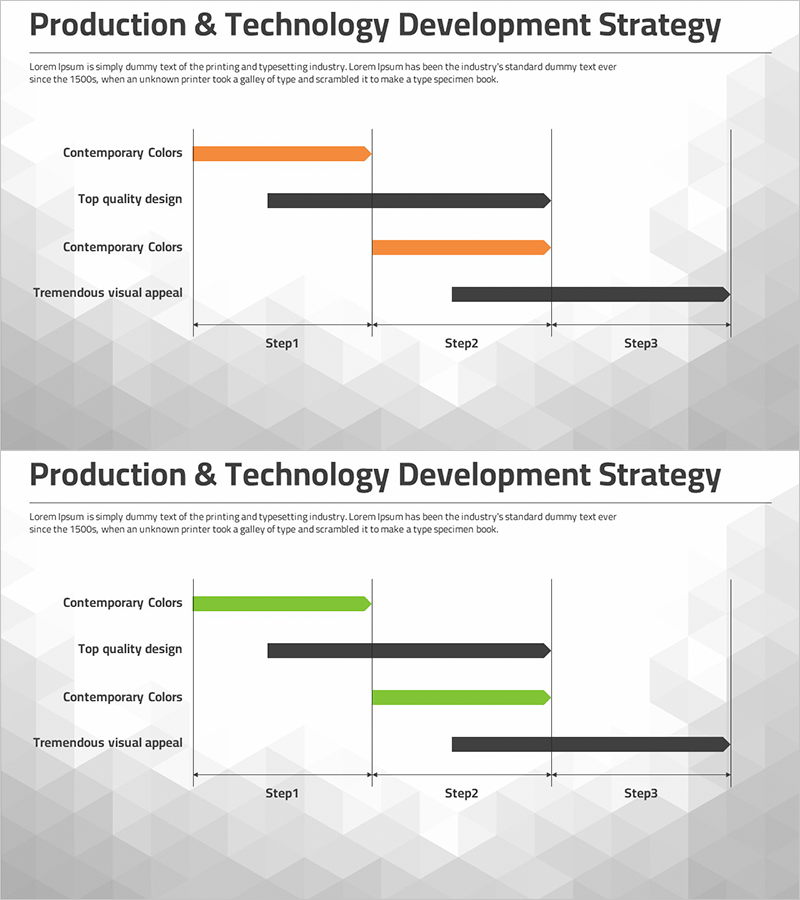
A PowerPoint slide that visualizes production and technology development strategy through a 3-step linear flowchart. Using orange and black horizontal bar charts, each phase displays timeline and priority clearly, making it immediately applicable to corporate strategy presentations, business implementation plans, and marketing proposals. The 2-slide set presents multiple color combinations to match your presentation tone, with fully editable text and data fields designed for seamless customization in your PowerPoint deck.
Usage Points
-
Main Usage
Designed to visualize the 3-phase production and technology development strategy along a timeline. Each phase displays key activities, objectives, and schedules in horizontal bar chart format, enabling executives and team members to grasp strategic direction at a glance.
-
How to Use
Insert into business strategy presentations, marketing plans, or product development roadmap sections where phase-based planning is explained. Adjust bar lengths and colors to reflect actual timelines, priorities, and resource allocation, then edit text labels to input specific phase names and descriptions.
-
Recommended For
Ideal for executives, strategy planners, marketing managers, and project leads presenting organizational mid-term strategies, new business initiatives, or technology development roadmaps. Particularly suited for 3-5 year business plans or quarterly milestone presentations using timeline-based visualization.
-
Slide Structure
2-slide set with first slide featuring 3 orange horizontal bars and second slide featuring 3 green bars, demonstrating color variation options. Each slide displays 4 items on Y-axis (Contemporary Colors, Top quality design, Contemporary Colors, Tremendous visual appeal) with Step1, Step2, Step3 phases on X-axis in horizontal bar chart layout.
Related Products
-

Aerospace Industry Phase-by-Phase Schedule Slide Template
#Business Strategy #Diagram #Step-by-Step Schedule Plan
-

Space Industry Stage Goal Diagram – Linear Flow for Strategic Initiatives
#Business Strategy #Diagram #Step-by-Step Schedule Plan
-

Space Industry Stage-by-Stage Goals - Strategic Approach
#Business Vision and Strategy #Business Strategy #Diagram
-

Visualizing Daily Work Processes – Effective Operational Planning
#Business Strategy #Operational Plan #Diagram
