Curved Charts for Products – Visualizing Market Conditions with Diagrams
RJ0900034_19
- Last Update 08/26/2025
- File Size 1.1MB
- # of Slides 2
- File Format PPTX
- Slide Ratio 16:9
- Color
Keywords
About the Product
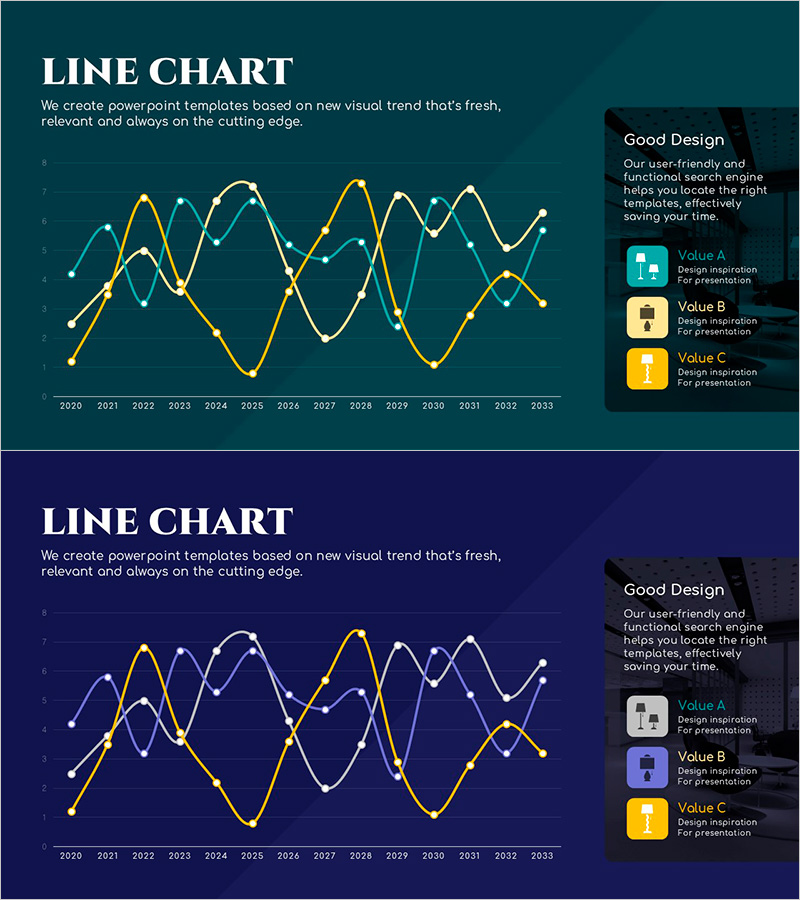
A professional line chart PowerPoint slide tracking market trends from 2020 to 2033 with three data series. The dark teal background features intersecting curves in gold, light blue, and white, clearly representing comparative product performance and market conditions. A legend box on the right displays Value A, B, and C with descriptive text, making it ideal for product comparison and market analysis presentations. The 2-slide deck in 16:9 format is fully editable and ready for business reports, marketing analysis, and financial presentations.
Usage Points
-
Main Usage
Visualize and compare multiple product lines, metrics, or indicators over time. Simultaneously display sales trends, market share evolution, customer satisfaction scores, or KPI tracking across different categories for comprehensive data analysis.
-
How to Use
Insert into business reports' market overview sections, marketing strategy presentations' competitive analysis, financial presentations' quarterly performance reviews, and executive briefings' KPI tracking dashboards. Easily customize the legend labels and data values to match your specific metrics and timeframe.
-
Recommended For
Finance, planning, marketing, and sales professionals; executive leadership meetings; quarterly and annual performance reviews; competitive benchmarking analysis; product lifecycle tracking; organizations requiring multi-metric trend visualization and data-driven decision making.
-
Slide Structure
Both slides feature identical layout: dark teal background with title and descriptive text on the left, central coordinate system with X-axis (2020–2033) and Y-axis (0–8) displaying three intersecting curves in gold, light blue, and white, and right-aligned black legend box containing three value indicators (Value A, B, C) with explanatory text. 16:9 widescreen format optimized for modern presentation displays.
Related Products
-

Green Analysis Chart for Market Overview – Effective Data Comparison
#Market and Competitor Analysis #Diagram #Graph
-

Analyze Market with Aurora Bending Line Chart – Competition and Opportunities
#Market and Competitor Analysis #Graph #Market Status
-

Chemical Experiment Analysis Broken Line Graph – Insights and Data Visualization
#Market and Competitor Analysis #Diagram #Graph
-

Usage Analysis Graph – Visualizing Market Status
#Market and Competitor Analysis #Diagram #Graph
