Business Analysis Line Graph – Visualizing Market Trends
RJ0300054_6
- Last Update 05/02/2025
- File Size 3MB
- # of Slides 2
- File Format PPTX
- Slide Ratio 16:9
- Color
Keywords
- #Content-Based Slides
- #Design-Based Slides
- #Market and Competitor Analysis
- #Graph
- #Market Status
- #Market Analysis
- #Line
- #Line Chart
- #16:9
- #line chart PowerPoint
- #trend analysis slide template
- #market visualization
- #business data chart
- #time series graph template
- #how to create line chart in PowerPoint
About the Product
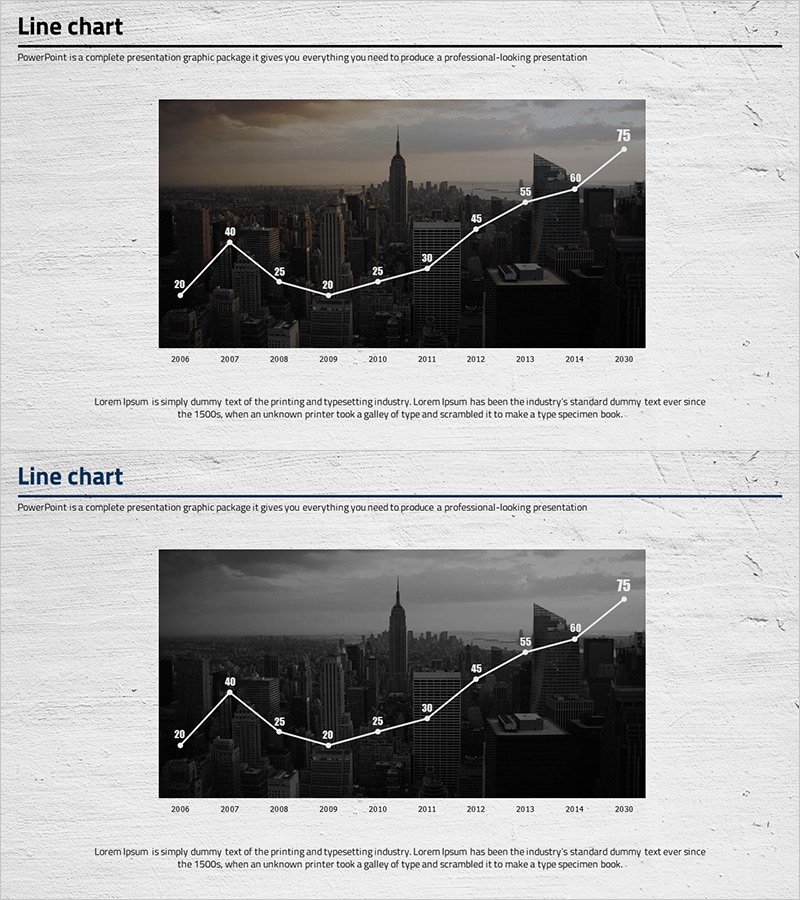
A professional line chart PowerPoint slide optimized for business analysis and market trend visualization. This 2-slide template features a 10-point data series spanning 2006 to 2030, overlaid on an urban skyline background with white line and numeric labels for intuitive trend communication. Available in 16:9 widescreen PPTX format, fully editable for immediate use. Perfect for presenting sales performance, visitor metrics, growth rates, and competitive benchmarking across time periods. Ideal for market analysis sections in pitch decks, quarterly reports, and business plans where temporal data comparison and trend identification are critical to stakeholder decision-making.
Usage Points
-
Main Usage
The core objective is to clearly visualize numerical changes and trends over time. Designed to help audiences instantly grasp patterns of sales volume, visitor counts, growth rates, and market share through ascending, descending, and fluctuating line movements.
-
How to Use
Deploy in market analysis sections of business plans, quarterly performance reports, and competitive landscape presentations. The urban background and white line contrast creates a professional atmosphere. Edit numeric labels and data points to input actual business metrics while maintaining visual consistency.
-
Recommended For
Marketing managers, executives, data analysts, and consultants presenting to leadership, investors, and strategy teams. Particularly suited for financial services, real estate, retail, and technology sectors requiring long-term trend analysis and performance tracking.
-
Slide Structure
2-slide layout featuring an urban skyline background with a 10-point line graph overlay. Each data point is labeled with years (2006–2030) on the x-axis and values (20–79) on the y-axis. Consistent line weight and color ensure data readability and professional appearance across both slides.
Related Products
-

Break Line Chart Analysis Summary - Market Status and Competitor Comparison
#Market and Competitor Analysis #Graph #Market Status
-

Geometry Wide Line Graph – Perfect Choice for Market Analysis
#Market and Competitor Analysis #Graph #Market Status
-

Usage Analysis Graph – Visualizing Market Status
#Market and Competitor Analysis #Diagram #Graph
-

Curved Charts for Products – Visualizing Market Conditions with Diagrams
#Market and Competitor Analysis #Graph #Market Status
