Geometry Wide Line Graph – Perfect Choice for Market Analysis
RJ0200034_28
- Last Update 04/07/2025
- File Size 0.1MB
- # of Slides 2
- File Format PPTX
- Slide Ratio 16:9
- Color
Keywords
About the Product
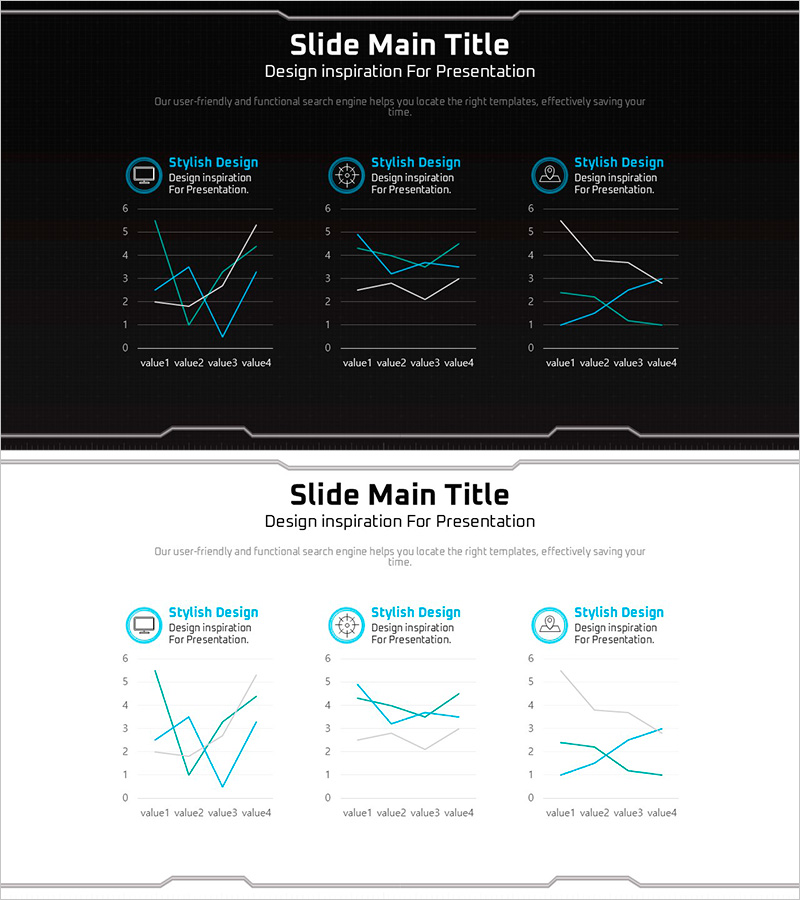
A multi-series line chart PowerPoint slide featuring geometric patterns and cyan-blue color scheme. The 2-slide template displays three independent line graphs side-by-side, enabling simultaneous comparison of multiple data trends. Each chart is built on 4 data points with icon labels for clear information hierarchy. Ideal for market analysis reports, performance dashboards, trend analysis presentations, and business intelligence slides ready to download and customize.
Usage Points
-
Main Usage
Visualize and compare multiple data series over time to reveal trends and patterns. Perfect for displaying quarterly performance metrics, competitive benchmarking, monthly KPI tracking, and time-series data analysis in executive presentations.
-
How to Use
Input your actual data into each line chart and modify axis labels and legends to match your report context. Adjust the number of series or data points as needed, and customize colors to align with your brand guidelines.
-
Recommended For
Marketing managers, financial analysts, project managers, and sales leaders presenting quarterly results, market trends, competitive analysis, and KPI performance metrics to stakeholders.
-
Slide Structure
2-slide layout with 3 independent line charts per slide. Each chart accommodates 4 data points (value1-4) with icon-labeled headers for visual clarity and information organization.
Related Products
-

Market Analysis and Status Graph Slide – Harmony of Green and Orange
#Market and Competitor Analysis #Graph #Market Status
-

Consumer Insights & Behavioral Patterns Analysis Slide
#Market and Competitor Analysis #Graph #Market Status
-

Break Line Chart Analysis Summary - Market Status and Competitor Comparison
#Market and Competitor Analysis #Graph #Market Status
-

Chemical Experiment Analysis Broken Line Graph – Insights and Data Visualization
#Market and Competitor Analysis #Diagram #Graph
