Analyzing Chart Results by Item – Understanding the Market and Customers
RJ0900034_14
- Last Update 08/26/2025
- File Size 0.8MB
- # of Slides 2
- File Format PPTX
- Slide Ratio 16:9
- Color
Keywords
About the Product
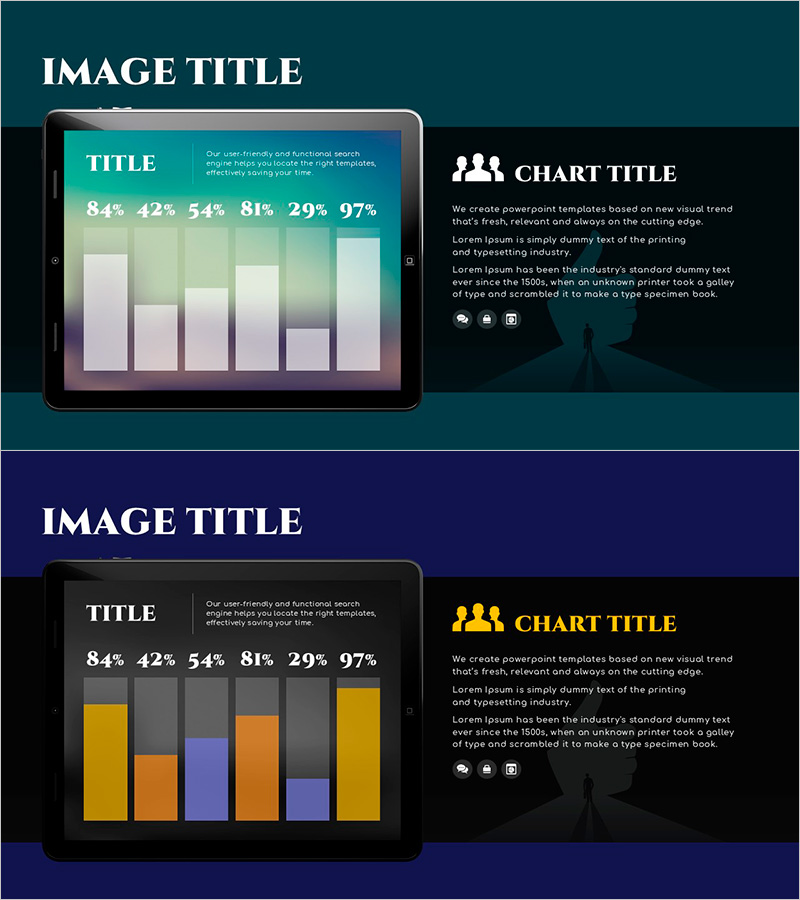
A PowerPoint slide designed for visualizing item-by-item chart results essential for market analysis and customer insights. The teal background combined with gold accent colors creates a two-tone design that effectively highlights data importance. The layout compares six items using a bar graph format, making it ready for immediate use in presentations and reports. The slide is divided into chart and text explanation areas for clear information delivery, and can be edited and inserted into corporate presentations, marketing plans, and business reports.
Usage Points
-
Main Usage
A chart slide that compares multiple items of numerical data at a glance, such as market conditions, customer characteristics, and competitor comparisons. The six-item bar graph visualizes percentages and metrics to present clear decision-making evidence.
-
How to Use
Insert into the market analysis or customer analysis section of business reports, marketing plans, or investor pitch decks. Edit the chart values and legend with your own data, then add analysis results and insights in the text areas.
-
Recommended For
Marketing teams, planning departments, sales teams, and executives presenting market conditions, customer segmentation, and competitive analysis results. Particularly effective in quantitative data-driven strategy sessions and decision-making meetings.
-
Slide Structure
Left side features a tablet mockup with a 6-bar graph and numerical data (84%, 42%, 54%, 81%, 29%, 97%), while the right side contains chart title, two text explanation areas, and three icons in a two-column layout.
Related Products
-

User Gender Ratio Analysis Graph – Essential Tool for Market and Customer Analysis
#Market and Competitor Analysis #Graph #Other
-

Customer and Market Analysis Slide – Yellow and Bluegreen Emotion
#Market and Competitor Analysis #Graph #Other
-

User Gender Ratio Analysis Graph – Effective Customer Insights
#Market and Competitor Analysis #Graph #Customer Analysis
-

Natural Environment Satisfaction Graph – Market and Customer Analysis
#Market and Competitor Analysis #Graph #Customer Analysis
