Business Area Analysis Graph & PC Mockup
RJ0300059_27
- Last Update 05/04/2025
- File Size 1MB
- # of Slides 2
- File Format PPTX
- Slide Ratio 16:9
- Color
Keywords
- #Content-Based Slides
- #Design-Based Slides
- #Technical Approach
- #Market and Competitor Analysis
- #Graph
- #Other
- #Research and Development
- #Market Analysis
- #Horizontal Bar
- #Segmented Horizontal Bar
- #Mockup
- #16:9
- #horizontal bar chart PowerPoint
- #segmented bar graph template
- #PC mockup slide
- #business analysis chart
- #data visualization PPT
- #bar chart download
About the Product
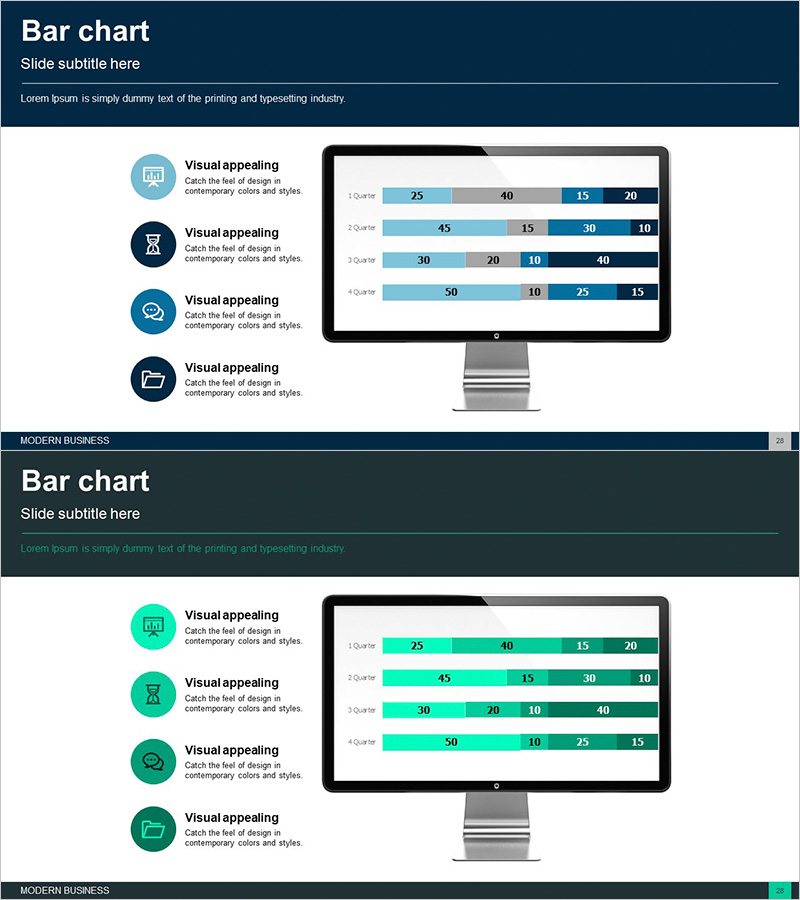
A 2-slide PowerPoint set combining a horizontal bar chart for business area analysis with a PC monitor mockup display. The first slide features a segmented horizontal bar chart comparing four quarters across four data categories, using light blue, dark blue, and gray color series to clearly differentiate data layers. The second slide displays the same chart within a PC monitor mockup frame, allowing you to preview the presentation in a realistic desktop environment. Ideal for market analysis, competitive benchmarking, departmental performance reviews, and quantitative data presentations. All values and labels are fully editable in PowerPoint.
Usage Points
-
Main Usage
Visualize quantitative data using a 4-series horizontal bar chart and simulate the actual presentation environment with a PC monitor mockup. Optimized for comparing quarterly results, departmental performance, regional metrics, competitive analysis, and market share data across multiple categories.
-
How to Use
Enter your data into the bar chart on the first slide and adjust colors as needed. Then place the same chart into the PC mockup frame on the second slide to preview the final presentation appearance. Use in business reports, strategy presentations, investor briefings, and client pitches to emphasize data credibility.
-
Recommended For
Finance, marketing, sales, and strategy professionals presenting quarterly performance, market analysis, and competitive positioning to executives, investors, and clients. Particularly effective for business plans, performance reports, and proposals where quantitative evidence is critical.
-
Slide Structure
Slide 1: Segmented horizontal bar chart with 4 quarters (Q1–Q4) × 4 data items, using 3-color series (light blue, dark blue, gray) / Slide 2: Same chart displayed within a PC monitor mockup frame with black border and gray stand
Related Products
-

Chemical Experiment Analysis Graph Chart – Visualizing R&D Achievements
#Technical Approach #Market and Competitor Analysis #Diagram
-

Camera Shooting App Analysis Graph – Visualization and Insights
#Product/Service Introduction #Market and Competitor Analysis #Graph
-

Graph Charts for Systematic Market Analysis – Bar and Pie Charts
#Technical Approach #Market and Competitor Analysis #Diagram
-

Horizontal Bar Graph Broken Down by Year – Optimal for Market and Competitor Analysis
#Market and Competitor Analysis #Graph #Competitor Analysis
