Planterior Market Overview – Insights through Horizontal Bar Graph
RJ0900033_13
- Last Update 08/26/2025
- File Size 0.2MB
- # of Slides 2
- File Format PPTX
- Slide Ratio 16:9
- Color
Keywords
- #Content-Based Slides
- #Design-Based Slides
- #Market and Competitor Analysis
- #Graph
- #Market Overview
- #Competitive Advantage
- #Horizontal Bar
- #Grouped Horizontal Bar
- #16:9
- #horizontal bar chart PowerPoint slide
- #brand comparison presentation
- #market share graph
- #3-item comparison chart
- #horizontal bar graph PowerPoint template
About the Product
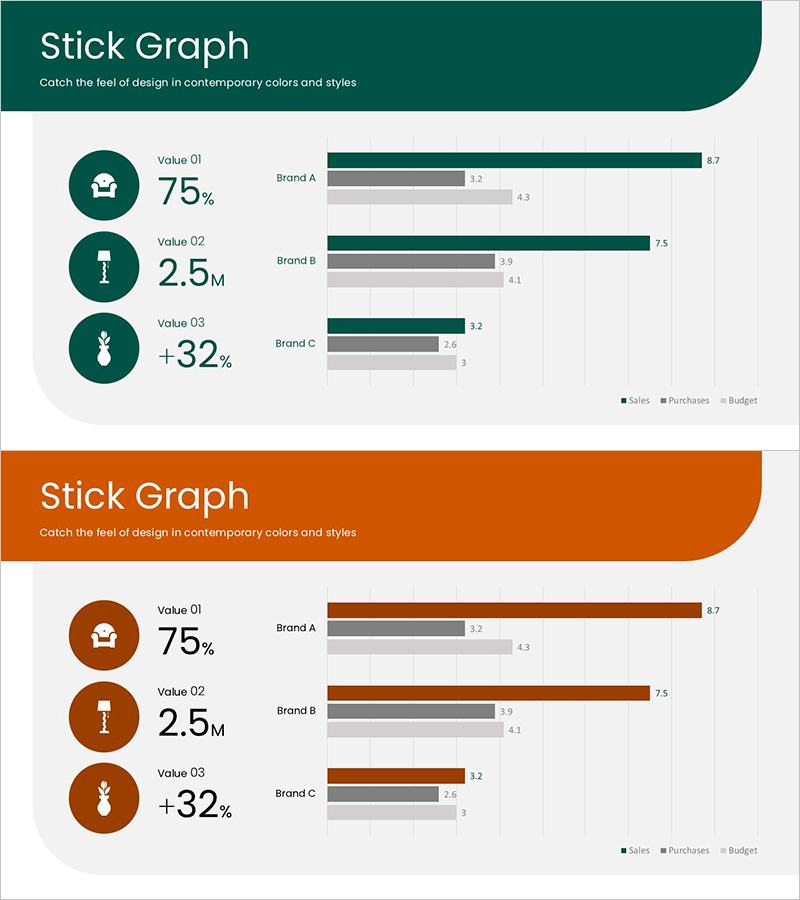
A PowerPoint slide comparing sales, purchases, and budget metrics across three brands using horizontal bar charts. The design features a dark green primary color with gray accents to clearly distinguish data layers. Three circular icons on the left highlight key metrics (75%, 2.5M, +32%), while the right side displays three-tier horizontal bars for intuitive brand-by-brand performance comparison. Available in 16:9 format with 2 slides, ready for immediate use in market overview presentations, competitive analysis, and business performance reports.
Usage Points
-
Main Usage
Visualize sales volume, purchase quantity, and budget scale across three brands or competitors using horizontal bar charts to instantly reveal market share and competitive positioning. The two-stage storytelling structure presents key performance indicators (KPIs) on the left, then provides detailed comparative analysis via the right-side graph.
-
How to Use
Deploy in market overview presentations, competitive analysis sessions, business performance reports, and marketing strategy development phases. Customize brand names, values, and legend entries to match your data. The dark green tone conveys trust and professionalism, making it ideal for B2B presentations and executive briefings.
-
Recommended For
Marketing teams presenting market analysis, executives reporting business performance, sales teams analyzing competitors, consulting firms producing industry reports, and investors reviewing IR materials. Suitable for any business presentation requiring comparison of three or more quantitative data points.
-
Slide Structure
Slide 1: Header area (dark green background + title) + left metric highlight section (3 circular icons + numeric text) + right horizontal bar chart area (3 brands × 3 data series = 9 bars). Slide 2: Identical layout in orange color variant. 16:9 aspect ratio optimized for widescreen presentations.
Related Products
-

Audio Icons and Comparison Graphs – A New Dimension in Market Analysis
#Market and Competitor Analysis #Graph #Market Analysis
-

Sales Status Average Slide
#Market and Competitor Analysis #Graph #Future Outlook
-

Vertical Bar Chart Slide for Data Comparison
#Market and Competitor Analysis #Graph #Competitor Analysis
-

Circular Gradient Wide Template Bar for Visualizing Performance
#Business Strategy #Market and Competitor Analysis #Graph
