Visualizing Market Status with Horizontal Bar Chart – Emphasizing Competitive Edge
RJ0600108_5
- Last Update 07/20/2025
- File Size 1.3MB
- # of Slides 2
- File Format PPTX
- Slide Ratio 16:9
- Color
Keywords
- #Content-Based Slides
- #Design-Based Slides
- #Market and Competitor Analysis
- #Graph
- #Market Status
- #Competitive Advantage
- #Horizontal Bar
- #Grouped Horizontal Bar
- #16:9
- #horizontal bar chart PowerPoint
- #bar graph slide template
- #market comparison chart
- #competitive analysis graph
- #year-over-year data visualization
About the Product
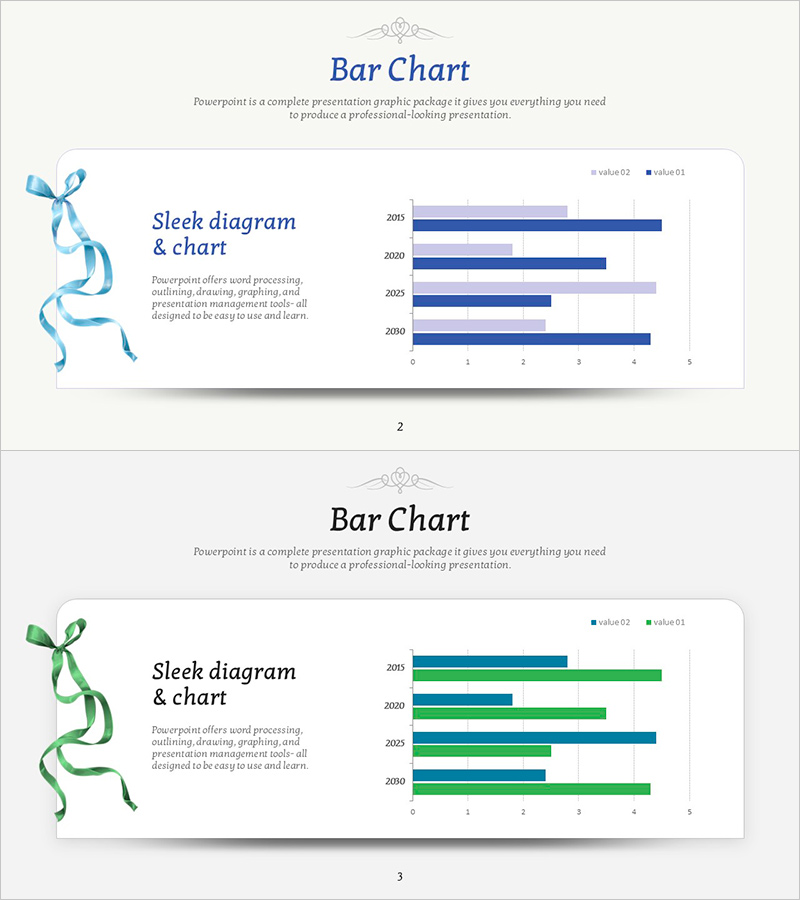
A horizontal bar chart PowerPoint slide comparing market status across four years (2010–2013) with two data series. The design uses blue and gray bar colors to visually emphasize competitive advantage, with a numeric axis ranging from 0 to 5 for clear quantitative representation. Year-over-year trends and series differences are instantly comparable, making this presentation slide ideal for market analysis, business performance reports, and competitive positioning presentations. The 16:9 widescreen format with 2-slide layout adapts to various presentation environments and is ready to edit with your own data.
Usage Points
-
Main Usage
Optimized for comparing market data and competitor performance across years using two-series horizontal bars, emphasizing competitive advantage. Quantitative values displayed on the horizontal axis enable intuitive size comparison, while year-over-year changes are clearly communicated.
-
How to Use
Apply to market analysis sections, business performance reports, sales presentations, and investor pitch decks where competitive positioning is critical. Simply input your data and adjust bar lengths and colors for immediate use. Easily extend with additional years or data series as needed.
-
Recommended For
Recommended for executives, marketing managers, business strategists, and sales teams presenting market conditions and competitive advantages. Suitable for quarterly and annual performance comparisons, product line sales analysis, regional market share comparisons, and other multi-year comparative scenarios.
-
Slide Structure
Two-slide layout with the first slide emphasizing blue series and the second displaying blue and green series. Each slide features a horizontal bar chart with four years (2010–2013) on the Y-axis and a 0–5 numeric range on the X-axis. Includes legend and title areas for clear data context and professional presentation.
Related Products
-

Product Analysis Comparison Graph – Visualizing Market Status
#Market and Competitor Analysis #Graph #Market Status
-

Natural Environment Horizontal Bar Graph – Market Analysis
#Market and Competitor Analysis #Graph #Market Status
-

Achievement Goals and Status Chart – Visualizing Competitive Advantage
#Market and Competitor Analysis #Graph #Market Status
-

Test Tube Bar Graph for Market Analysis – Highlighting Competitive Advantage
#Market and Competitor Analysis #Graph #Market Status
