Line Graph for Camping Market Analysis – Market Trends and Competitive Advantage
RJ0600032_8
- Last Update 06/29/2025
- File Size 0.8MB
- # of Slides 2
- File Format PPTX
- Slide Ratio 16:9
- Color
Keywords
- #Content-Based Slides
- #Design-Based Slides
- #Market and Competitor Analysis
- #Graph
- #Market Status
- #Competitive Advantage
- #Line
- #Line Chart
- #16:9
- #line chart PowerPoint slide
- #dual-series trend comparison
- #time-series data visualization
- #line graph template download
- #how to create line chart in PowerPoint
About the Product
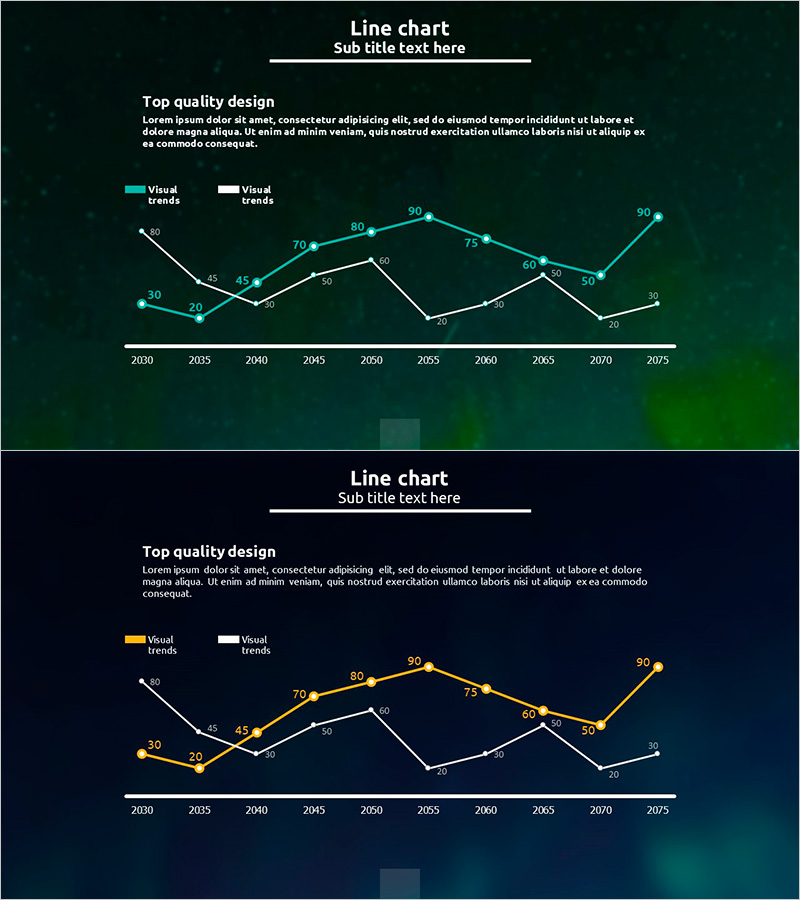
A dual-series line chart PowerPoint slide designed to compare long-term trends across two data sets from 2030 to 2075. The slide features two distinct lines in teal and black, with labeled data points at each year interval, enabling precise value comparison and trend visualization. A legend clearly identifies each series, while the title and description areas are fully editable to match your presentation context. The 16:9 widescreen format with 2-slide layout is ready for immediate use in market analysis, performance reports, competitive benchmarking, and strategic presentations.
Usage Points
-
Main Usage
Effectively visualize long-term trend changes and performance comparison between two groups or metrics. Ideal for market analysis, competitive positioning, year-over-year performance tracking, and business indicator trends. Data point labels ensure accurate numerical communication without additional explanation.
-
How to Use
Replace the sample data points and axis labels with your actual figures. Update the legend text to reflect your comparison categories (e.g., Product A vs Product B, Region 1 vs Region 2). Customize the title and description text to match your presentation topic. Colors can be adjusted to align with your corporate branding.
-
Recommended For
Marketing strategy presentations, business performance reports, investor pitch decks, market research analysis, executive briefings, and competitive analysis documents. Particularly effective when comparing departmental performance, product metrics, or regional results.
-
Slide Structure
Dual-line chart with 10 data points spanning 2030–2075, individual value labels on each point, 2-item legend, horizontal axis (years), vertical axis (values), title section, and descriptive text area. Package includes 2 identically structured slides for flexible presentation design.
Related Products
-

Blue Green Basic Line Chart – Market Status and Competitive Analysis
#Market and Competitor Analysis #Graph #Market Status
-

Line Graph for Market Trends Visualization – Competitive Advantage Analysis
#Market and Competitor Analysis #Graph #Market Status
-

Colorful Bell Graph Slide – Market Status Analysis
#Market and Competitor Analysis #Graph #Market Status
-

Work Stress Visualized with Line Chart – Analysis and Competitive Advantage
#Market and Competitor Analysis #Graph #Market Status
