Trading Business Income Statement – Effective Financial Performance Presentation
RJ0300017_10
- Last Update 04/22/2025
- File Size 0.1MB
- # of Slides 2
- File Format PPTX
- Slide Ratio 16:9
- Color
Keywords
- #Content-Based Slides
- #Design-Based Slides
- #Financial Plans and Performance
- #Diagram
- #Income Statement
- #Key Financial Indicators
- #Table
- #Standard Table
- #16:9
- #table diagram PowerPoint
- #financial table template
- #income statement slide
- #data comparison PowerPoint slide
- #3-column table template
- #financial performance chart
About the Product
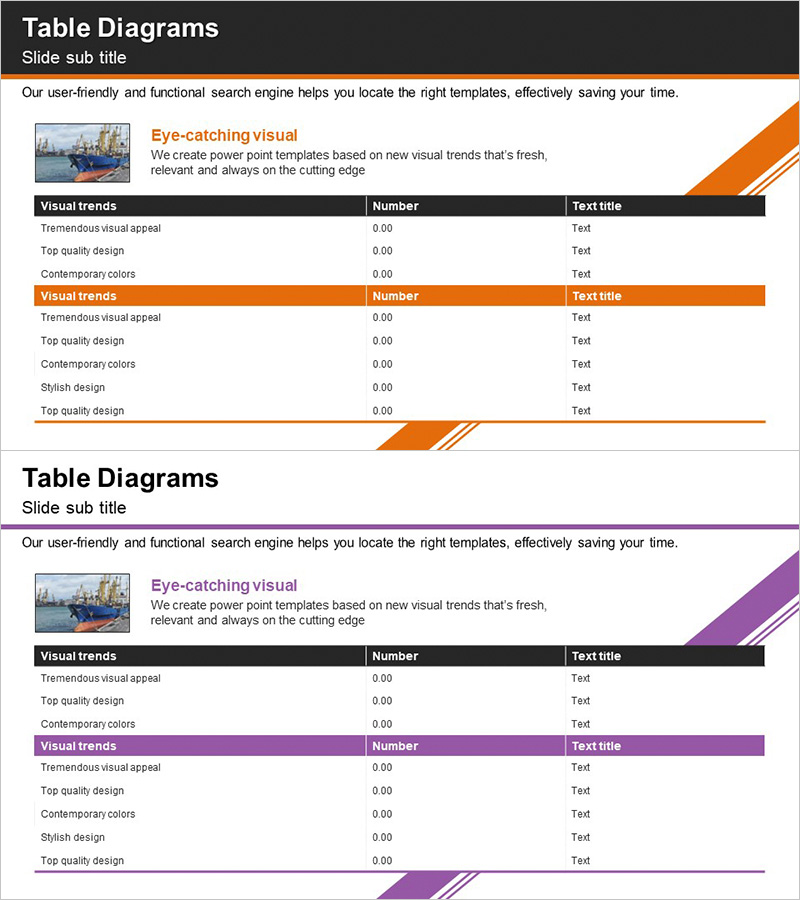
A 3-column table structure PowerPoint slide designed for income statements and financial performance analysis. Available in two color versions—orange and purple—each featuring a clear header row and data rows for organized information layout. This presentation template effectively visualizes numerical comparisons and performance metrics for business presentations on trading operations, financial planning, and key financial indicators. Provided as a 2-slide deck in 16:9 widescreen format, ready for immediate use and customization.
Usage Points
-
Main Usage
Organize and compare financial performance, income statements, and key metrics in a systematic tabular format. Presents trading business results, departmental performance, quarterly financial status, and other numerical data in a clear row-and-column structure that enhances audience comprehension.
-
How to Use
Use in financial reports, business performance presentations, and investor briefings by entering income statement data or financial metrics into the slide table. Edit the header row labels and data row values as needed, and select the color version that matches your presentation theme and tone.
-
Recommended For
Recommended for CFOs, finance managers, business directors, and investor relations professionals who need to present financial performance. Ideal for trading companies, manufacturing firms, financial institutions, and other industries requiring quantitative data-driven presentations.
-
Slide Structure
Consists of 2 slides, each featuring a 3-column table structure (item name, metric 1, metric 2) with multiple data rows. The header row is highlighted with an orange or purple background, while data rows use white backgrounds with black text for readability. Diagonal graphic elements positioned at slide corners provide visual emphasis and design continuity.
Related Products
-

Insight Summary Table – Visualizing Financial Plans and Performance
#Financial Plans and Performance #Diagram #Income Statement
-

Premium Management Presentation Table – Efficient Financial Planning
#Financial Plans and Performance #Diagram #Income Statement
-

Key Financial Indicators Table – Clear Profit Analysis
#Financial Plans and Performance #Diagram #Income Statement
-

Paper Theme Key Financial Indicators Slide
#Financial Plans and Performance #Diagram #Income Statement
