Furniture Development Plan Slide – Visual Trends through Market Analysis
RJ0900032_21
- Last Update 08/26/2025
- File Size 7.3MB
- # of Slides 2
- File Format PPTX
- Slide Ratio 16:9
- Color
Keywords
About the Product
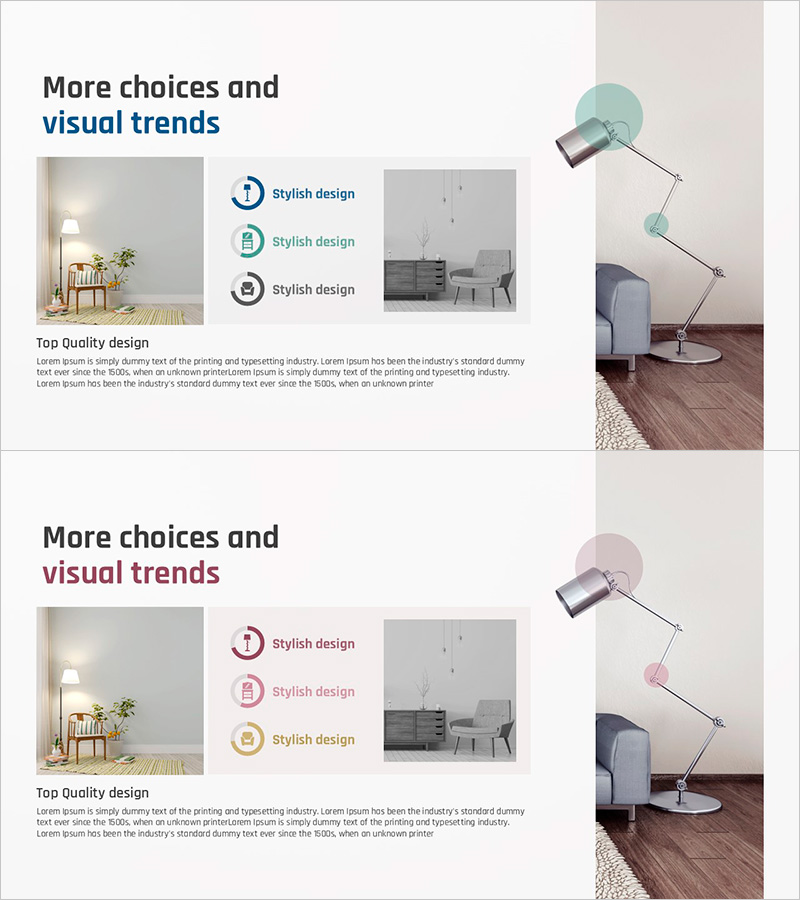
A donut chart PowerPoint slide designed to visualize furniture industry market analysis and visual trends. This slide template features a three-segment donut chart structure that effectively displays multiple data series simultaneously, making it ideal for ratio comparison and composition analysis. The design combines a light beige background with teal, pink, and gray donut segments, complemented by a linear connection diagram on the right side to represent trend elements. Perfect for furniture development plans, market research presentations, consumer preference analysis, and business strategy discussions. Includes 2 slides in 16:9 widescreen format, fully editable in PPTX.
Usage Points
-
Main Usage
Visualize data ratios and market analysis results using donut chart design. Effectively communicate furniture market segmentation, consumer preference distribution, and product category market share to stakeholders and decision-makers.
-
How to Use
Edit the donut chart segments on slide 1 with your data values and category labels. Customize the linear trend diagram on slide 2 with relevant trend factors. Modify colors and data points to match your specific analysis and branding requirements.
-
Recommended For
Furniture and interior design company executives presenting market reports, market research analysts sharing findings, product development teams discussing market positioning, and investment pitch presentations explaining market size and opportunities.
-
Slide Structure
Slide 1: 3-segment donut chart (teal, pink, gray tones) with text area / Slide 2: Donut chart + right-side linear connection diagram (3 nodes with arrow connectors) + furniture interior photo mockup. 16:9 widescreen format, fully editable PPTX.
Related Products
-

Visualizing Competitive Analysis with Table and 3 Donut Graphs
#Market and Competitor Analysis #Diagram #Graph
-

Shareholder Status Survey Donut Graph – Optimized for Market Analysis
#Company Introduction #Market and Competitor Analysis #Diagram
-

Shareholder Status Analysis Slide – Data-Driven Market Insights
#Company Introduction #Market and Competitor Analysis #Diagram
-

Work Environment Survey Donut Chart – Market Share Visualization
#Market and Competitor Analysis #Graph #Market Share
