Table Analysis Summary Box – Visualizing Financial Performance
RJ0900031_16
- Last Update 08/25/2025
- File Size 0.2MB
- # of Slides 2
- File Format PPTX
- Slide Ratio 16:9
- Color
Keywords
- #Content-Based Slides
- #Design-Based Slides
- #Financial Plans and Performance
- #Diagram
- #Capital Requirements
- #Key Financial Indicators
- #Table
- #16:9
- #financial performance table PowerPoint
- #data comparison slide
- #financial analysis presentation
- #performance summary table
- #how to visualize financial metrics in PowerPoint
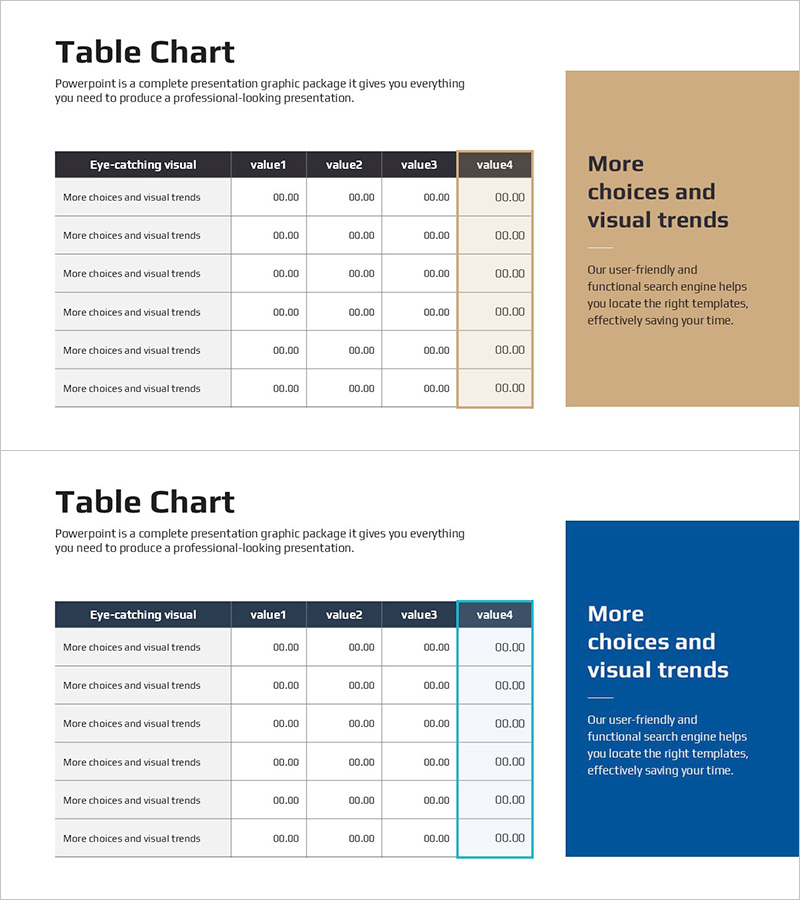
About the Product
A professional PowerPoint slide that visualizes financial performance using a table format with two-column layout. The left side features a 6-row data table with four value columns, while the right side includes a color-coded box and text area for key insights. Available in two color schemes—beige and dark blue—allowing you to match your corporate branding. Each slide accommodates numerical data and descriptive text simultaneously, making it ideal for financial metrics, performance summaries, and KPI analysis in presentations. All elements are fully editable in PPTX format, and additional data rows can be easily inserted as needed.
Usage Points
-
Main Usage
This slide clearly communicates financial performance, key metrics, and performance summaries in table format. Input numerical data in the left table and write core insights in the right box to present both data and analysis simultaneously.
-
How to Use
Use this slide in investor presentations, executive reports, and financial analysis decks to explain performance indicators. Replace table row labels with financial items (revenue, profit, ROI, etc.) and fill the right box with analysis results or strategic implications.
-
Recommended For
Ideal for CFOs, finance managers, executives, and investor relations professionals presenting quarterly or annual financial performance. Also effective for business plans, investment pitch decks, and management reports when summarizing key financial metrics.
-
Slide Structure
Two-slide set, each with a left-side 6-row, 4-column data table and right-side color box (beige or dark blue) with text area. Table headers follow 'Item·value1·value2·value3·value4' format, with all cells fully editable.
Related Products
-

Marketing Income Statement Table – Financial Performance Analysis
#Financial Plans and Performance #Diagram #Capital Requirements
-

Rainbow Presentation Template Chart and Icons – Enhance Your Financial Planning
#Financial Plans and Performance #Diagram #Capital Requirements
-

Investment and Fund Management Plan Slide – Financial Insights
#Financial Plans and Performance #Diagram #Capital Requirements
-

Funding Plan Table for Financial Planning Slide
#Financial Plans and Performance #Diagram #Capital Requirements
