Sales and Cost Area Graphs – Market Analysis Visualization
RJ0900030_26
- Last Update 08/25/2025
- File Size 0.2MB
- # of Slides 2
- File Format PPTX
- Slide Ratio 16:9
- Color
Keywords
About the Product
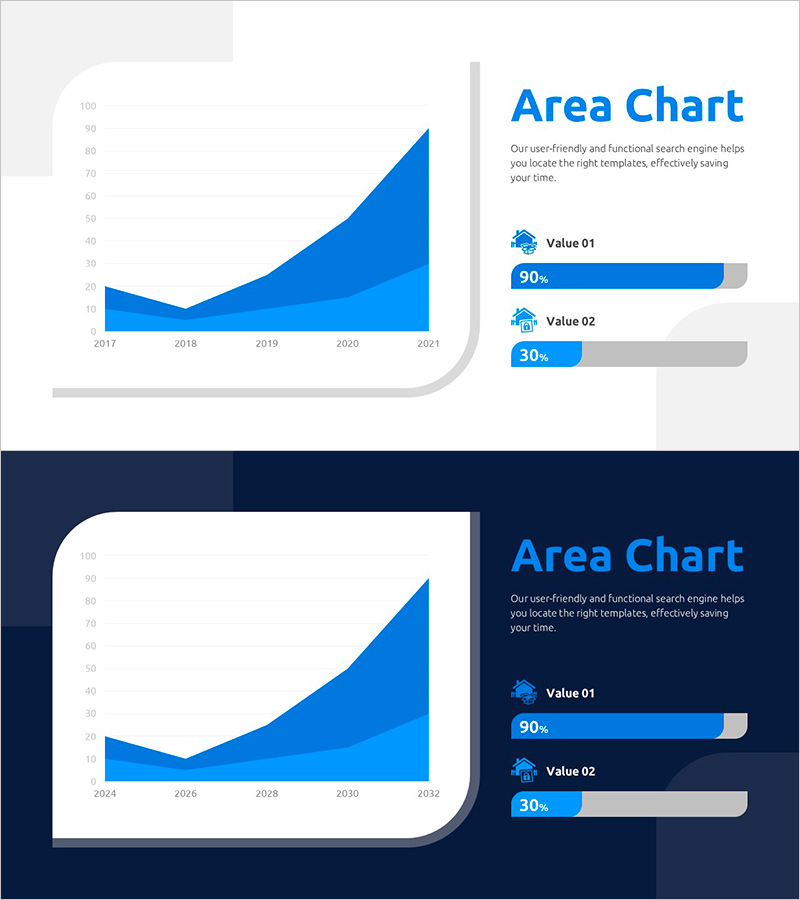
A PowerPoint slide featuring area charts that visualize sales and cost trends over time. Two design versions are included: light background and dark background layouts. Each slide displays a 5-year area chart (2017–2021) with dual-layer data representation, paired with percentage comparison bar charts on the right side. Ideal for financial presentations, market analysis reports, and investor pitches where data-driven insights need clear visual communication. Provided in 16:9 widescreen PPTX format, fully editable in all PowerPoint versions.
Usage Points
-
Main Usage
Visualize sales and cost trends over time using stacked area charts to communicate financial performance, market share changes, and competitive growth rates to decision-makers with clarity and impact.
-
How to Use
Insert into business plans, investor pitch decks, or quarterly earnings reports in the market analysis or financial sections. Replace chart data with actual figures and customize titles and legends to match your presentation context.
-
Recommended For
Finance professionals, executives, and investor audiences. Particularly effective for quarterly and annual performance reviews, market trend explanations, and competitive positioning presentations that require data credibility.
-
Slide Structure
Each slide combines a left-side area chart (5-year timeline 2017–2021 with 2-layer data) and a right-side content area (title, descriptive text, and two percentage bar charts labeled Value 01 and Value 02). Two background options provided.
Related Products
-

Residential Lighting Graph – Market Analysis
#Market and Competitor Analysis #Graph #Other
-

Simple Mixed Rounded Vertical Bar Graph – Intuitive Representation of Market Status
#Market and Competitor Analysis #Graph #Other
-

Employment Gender Ratio Analysis Slide
#Market and Competitor Analysis #Graph #Other
-

Graph of Sales by Region – Visualizing Market Status
#Market and Competitor Analysis #Graph #Other
