Graph Slide Highlighting the Importance of Drinking Water - Market Analysis
RJ0800021_12
- Last Update 08/05/2025
- File Size 1MB
- # of Slides 2
- File Format PPTX
- Slide Ratio 16:9
- Color
Keywords
- #Content-Based Slides
- #Design-Based Slides
- #Market and Competitor Analysis
- #Graph
- #Other
- #Market Status
- #Market Analysis
- #16:9
- #market analysis graph PowerPoint
- #market share bar chart slide
- #data visualization PowerPoint template
- #competitive analysis slide
- #how to create market analysis slides in PowerPoint
About the Product
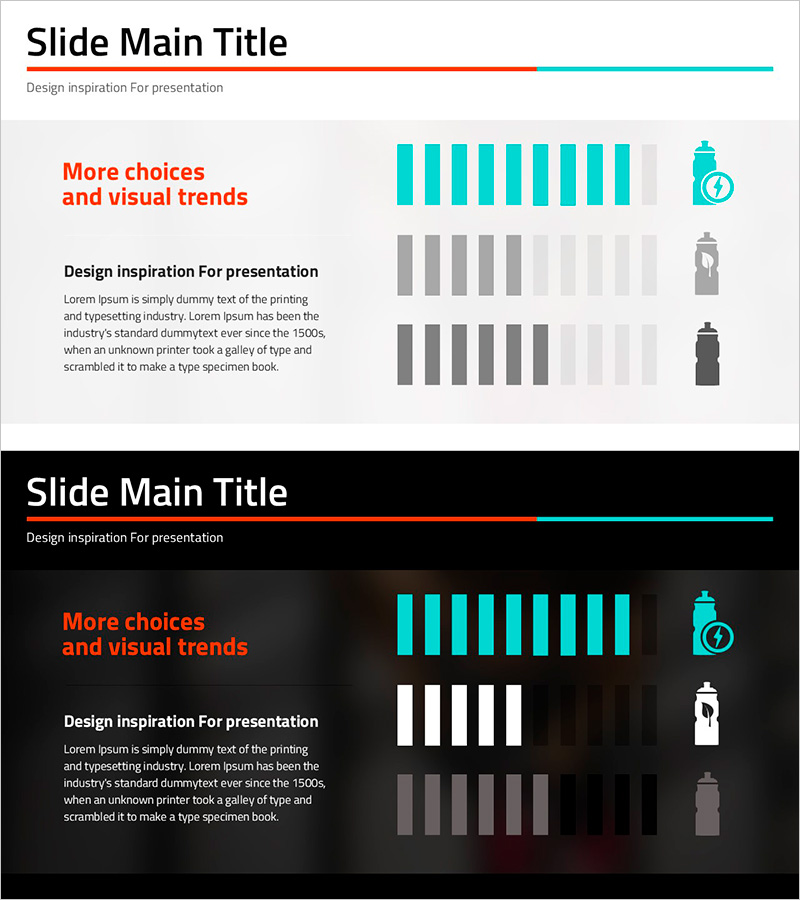
A 2-slide PowerPoint presentation designed to visualize market analysis data with clarity and impact. Features turquoise and gray vertical bar charts that compare multiple data layers across three distinct sections. The layout includes a title area, descriptive text block, and three graph sections optimized for presenting quantitative market data such as market share, competitive benchmarking, and market trends. Delivered in 16:9 widescreen PPTX format, fully editable and ready for immediate use in presentations, reports, and slide decks.
Usage Points
-
Main Usage
Presents quantitative market data through visual bar chart comparison, enabling stakeholders to quickly grasp market share distribution, competitive positioning, and market dynamics. The height differential of bars provides immediate visual insight into relative market performance.
-
How to Use
Insert into the market analysis section of business plans, investor pitch decks, or marketing strategy presentations. Use turquoise bars for primary metrics and gray bars for comparative benchmarks. Replace placeholder text with specific market data, percentages, and strategic insights relevant to your analysis.
-
Recommended For
Ideal for executive presentations, investor relations meetings, and partner briefings where objective market data supports strategic decisions. Marketing teams, strategy departments, and sales organizations use this layout for quarterly reports, market reviews, and competitive positioning discussions.
-
Slide Structure
Title and subtitle area at top, descriptive text block in center-left, and three graph sections on the right. Each graph contains 10 vertical bars in turquoise and gray gradients, with icon elements on the far right to reinforce information hierarchy and visual balance.
Related Products
-

Idea Presentation Template Wide – Market Analysis and Visualization
#Market and Competitor Analysis #Graph #Other
-

Sales and Cost Area Graphs – Market Analysis Visualization
#Market and Competitor Analysis #Graph #Other
-

Residential Lighting Graph – Market Analysis
#Market and Competitor Analysis #Graph #Other
-

Employment Gender Ratio Analysis Slide
#Market and Competitor Analysis #Graph #Other
