Triangular Prism Graph for Visualizing Market Status – Insights and Analysis
RJ0300053_12
- Last Update 05/02/2025
- File Size 1.8MB
- # of Slides 2
- File Format PPTX
- Slide Ratio 16:9
- Color
Keywords
About the Product
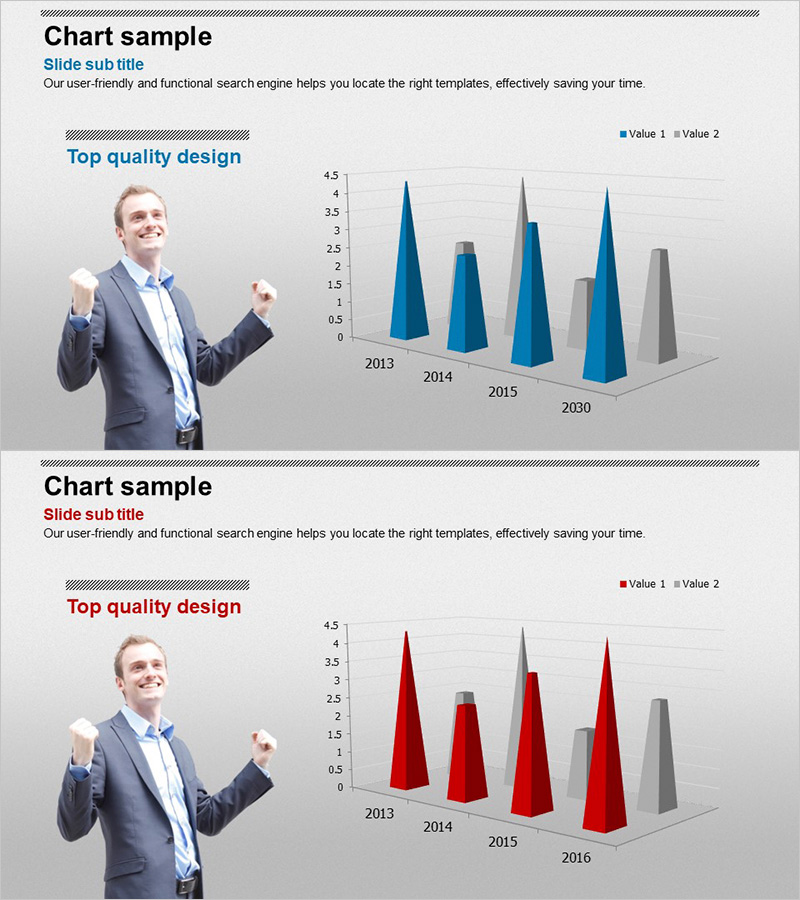
A professional PowerPoint slide featuring 3D triangular prism charts for intuitive visualization of market status and competitive analysis data. This presentation template includes 2 slides with blue and gray dual-color prism graphs that clearly compare year-over-year numerical trends. Ideal for business presentations, market analysis reports, and competitive benchmarking where you need to emphasize market trajectory, revenue comparison, and competitive positioning. Designed in 16:9 widescreen format for optimal compatibility with modern projectors and displays.
Usage Points
-
Main Usage
Utilize 3D triangular prism graphs to visualize market conditions, revenue trends, and competitive benchmarking data at a glance. Dual data series (Value 1 and Value 2) enable simultaneous representation of multiple metrics, enhancing clarity in comparative analysis.
-
How to Use
Insert into business reports, market analysis presentations, and executive briefing materials for year-over-year performance comparison or competitive positioning sections. The 2-slide structure allows sequential explanation of data trends. All numerical values and legends are fully editable directly in PowerPoint.
-
Recommended For
Marketing professionals, business analysts, sales managers, management consultants, and financial analysts preparing market analysis and competitive strategy presentations. Particularly effective for quarterly and annual performance comparison briefings.
-
Slide Structure
2-slide layout with one 3D triangular prism graph per slide. Represents dual data series in blue and gray color schemes, comparing 4–5 year periods with 3D prism columns. Includes legend and axis labels for easy data interpretation and professional presentation.
Related Products
-

Green-Blue Regional Chart Analysis – Market Status and Competitor Analysis
#Market and Competitor Analysis #Graph #Other
-

Industrial Data Report for Market Analysis Slides
#Market and Competitor Analysis #Diagram #Graph
-

Mint Green Mixed Graph – Market Status Analysis
#Market and Competitor Analysis #Graph #Other
-

Residential Lighting Graph – Market Analysis
#Market and Competitor Analysis #Graph #Other
