Market Status Donut Pie Chart – Intuitive Data Visualization
RJ0400011_27
- Last Update 05/20/2025
- File Size 0.4MB
- # of Slides 2
- File Format PPTX
- Slide Ratio 16:9
- Color
Keywords
- #Content-Based Slides
- #Design-Based Slides
- #Market and Competitor Analysis
- #Diagram
- #Graph
- #Market Status
- #Cluster
- #Circles
- #Closed Cluster Diagram
- #Doughnut Chart
- #16:9
- #donut pie chart PowerPoint
- #circular chart template
- #market status slide
- #data visualization presentation
- #ratio comparison slide
About the Product
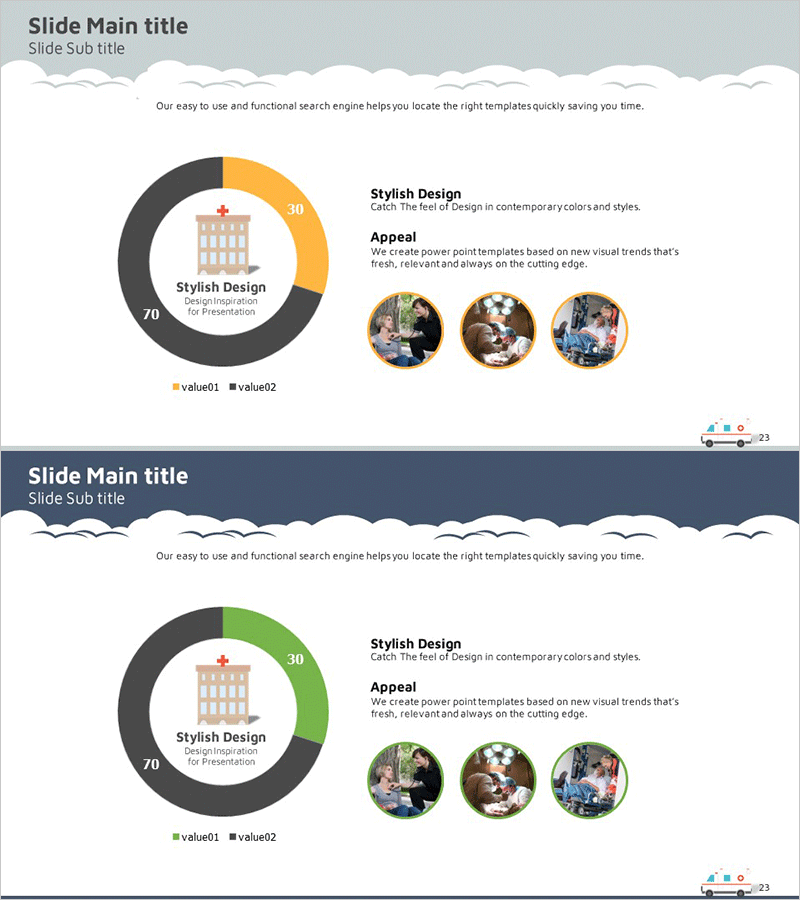
A donut pie chart PowerPoint slide that intuitively presents market status and comparative data. The design features a two-segment donut chart with a central icon and text area, flanked by a 'Stylish Design' section and 'Appeal' description on the right. Three circular image frames allow for additional visual emphasis. The color palette combines gray, orange, and black tones, creating a professional appearance suitable for business presentations. This 16:9 widescreen template includes 2 slides ready for immediate editing and customization to display your specific market data and insights.
Usage Points
-
Main Usage
Visualizes two-item comparative ratios such as market share, competitor comparison, customer composition, or product sales distribution using a donut pie chart. The central icon area emphasizes the core topic while the right-side text section provides supplementary explanation and context.
-
How to Use
Apply to business presentations including market analysis, management status reports, business plans, and investment pitch decks. Edit the chart values and legend to input your actual data, then insert relevant photos into the image frames to create a compelling, data-driven slide that supports your narrative.
-
Recommended For
Ideal for executives, marketing managers, sales teams, consultants, and analysts who rely on data-driven decision-making. Perfect for presentations on market analysis, competitive strategy development, business performance reporting, and quantitative information delivery.
-
Slide Structure
2-slide set. Each slide features a two-segment donut pie chart on the left with central icon area, paired with 'Stylish Design' and 'Appeal' text sections and three circular image frames on the right. Title and subtitle areas appear at the top, with page numbers at the bottom.
Related Products
-

Graph of User Status Analysis by Age Group
#Market and Competitor Analysis #Diagram #Graph
-

Natural Recreation Area Preference Chart – Market Status Analysis
#Market and Competitor Analysis #Diagram #Graph
-

Market Share Analysis Graph by Technology – Competition and Collaboration
#Market and Competitor Analysis #Diagram #Graph
-

Doughnut Chart Slide for Market and Competitive Analysis – Sports Trends & Strategic Issues
#Market and Competitor Analysis #Diagram #Graph
