Visualizing Sales Performance with Structural Photos and Graphs
RJ0900029_5
- Last Update 08/25/2025
- File Size 1.4MB
- # of Slides 2
- File Format PPTX
- Slide Ratio 16:9
- Color
Keywords
About the Product
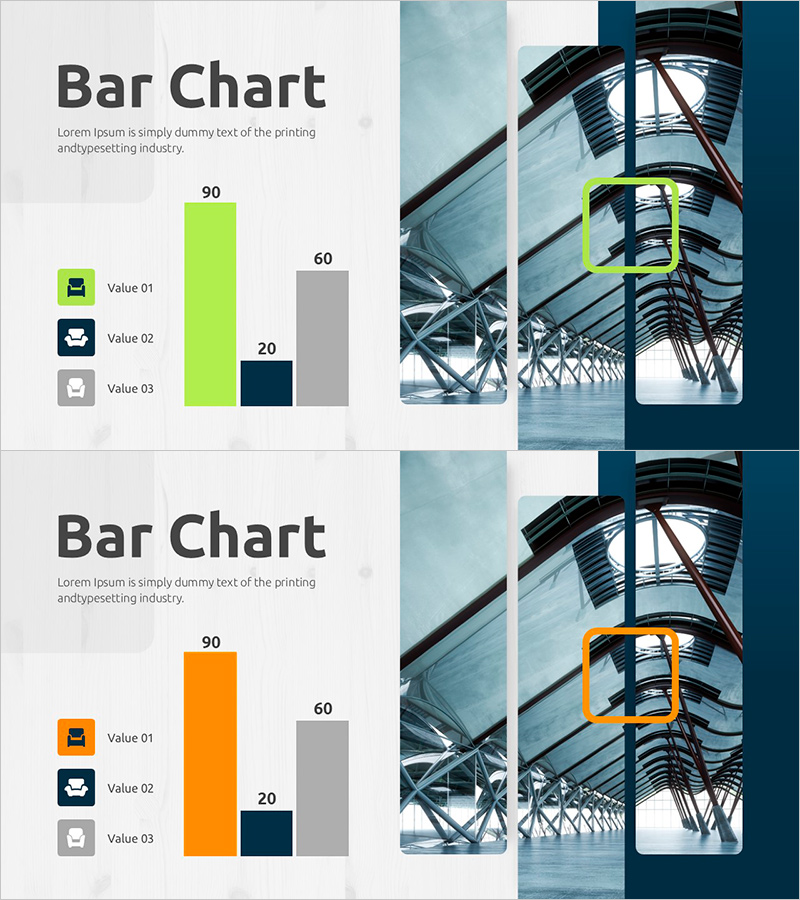
A PowerPoint slide combining industrial structural photography with a horizontal bar chart for data visualization. The design uses lime, dark navy, and gray colors to compare three data values, with a construction and infrastructure background image on the right side emphasizing industry credibility. Clear legend and data labels make this presentation slide ready for immediate use in financial reports, performance analysis, and sales presentations. Provided in 16:9 widescreen format with 2 slides in PPTX.
Usage Points
-
Main Usage
Optimized for comparing and analyzing three data points such as sales performance, financial results, or departmental metrics at a glance. The industrial background visually conveys corporate credibility and professionalism, making it effective for investor presentations, executive briefings, and quarterly performance reports.
-
How to Use
Edit the bar lengths and values with your own data, then update the legend text with your item names. The background image is fixed, so you only need to modify the chart area to quickly complete your presentation. Color adjustments are also possible to match your company's brand colors.
-
Recommended For
Recommended for finance teams, sales departments, executives, consultants, and analysts who need to visualize and report quantitative data. Particularly suitable for performance presentations and investment pitches in manufacturing, construction, energy, and infrastructure industries.
-
Slide Structure
Two-slide set with the first slide featuring lime accent color and the second with orange accent color on horizontal bar charts. Each slide displays three data items (Value 01, 02, 03) with bars positioned on the left, while the right half features an industrial structure photograph as background. Clear legend and numerical labels ensure easy data interpretation.
Related Products
-

Analysis of Factors Contributing to Excellent Sales Performance – Visualizing Success
#Business Strategy #Financial Plans and Performance #Graph
-

Basic Vertical Bar Chart Slide – Market Status Analysis
#Market and Competitor Analysis #Financial Plans and Performance #Graph
-

Modern Wide PowerPoint Template Bar chart&Table
#Business Introduction #Financial Plans and Performance #Diagram
-

Typographic Wide Template Bar Chart & Table – Competitive Analysis and Performance
#Market and Competitor Analysis #Financial Plans and Performance #Diagram
