Donut Chart by Lighting Sales Rankings – Market Data Analysis
RJ0900029_27
- Last Update 08/25/2025
- File Size 0.9MB
- # of Slides 2
- File Format PPTX
- Slide Ratio 16:9
- Color
Keywords
- #Content-Based Slides
- #Design-Based Slides
- #Market and Competitor Analysis
- #Financial Plans and Performance
- #Diagram
- #Graph
- #Competitive Advantage
- #Sales and Revenue
- #Structure
- #Circles
- #Pyramid Chart
- #Doughnut Chart
- #16:9
- #donut chart PowerPoint
- #pie chart slide template
- #sales ranking visualization
- #market analysis chart
- #donut graph PowerPoint download
About the Product
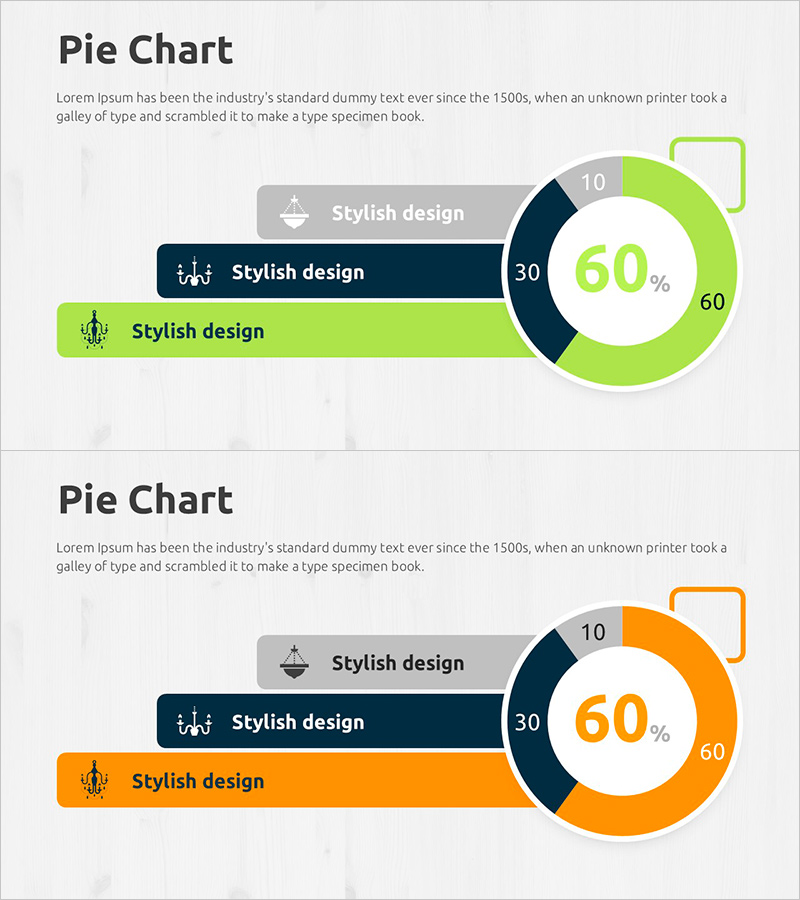
A donut chart PowerPoint slide that visualizes lighting product sales rankings with three data segments. The donut graph uses lime green, dark navy, and gray colors to represent market share and sales distribution, with percentage values and numerical data displayed for each segment. A left-aligned legend with icons and text labels enables clear data interpretation. This 2-slide template is ready to use in financial reports, marketing presentations, and business analysis documents for competitive analysis and revenue overview sections.
Usage Points
-
Main Usage
Displays three data segments—product sales rankings, market share, and revenue distribution—in a donut chart format. The central 60% figure highlights key data, while the outer donut ring and left legend provide detailed segment information for clear audience understanding.
-
How to Use
Insert into financial reports' revenue sections, marketing presentations' competitive analysis pages, or business analysis documents' market data slides. Edit text and values to reflect your product data or competitor comparisons. Customize colors to match your brand guidelines while maintaining the donut structure.
-
Recommended For
Finance managers, marketing planners, sales directors, and executives preparing data-driven presentations. Ideal for explaining product category sales performance, regional market share, or customer segment revenue composition.
-
Slide Structure
2-slide set. Each slide features a 3-color donut ring (lime green, dark navy, gray) representing three data series, with the primary metric (60%) emphasized in the center. A left-side legend with 3 icon-labeled items is vertically arranged, and a highlight box in the upper right provides visual balance.
Related Products
-

Service Sector Development Status Graph – Visualizing Competitive Edge with Doughnut Chart
#Product/Service Introduction #Market and Competitor Analysis #Graph
-

Typographic Wide Template Bar Chart & Table – Competitive Analysis and Performance
#Market and Competitor Analysis #Financial Plans and Performance #Diagram
-

Competitive Advantage Analysis Silhouette Graph – Market and Competitor Insights
#Product/Service Introduction #Market and Competitor Analysis #Graph
-

Fantastic Donut Chart – A Slide for Effective Market Analysis
#Market and Competitor Analysis #Financial Plans and Performance #Graph
