Ranking of Vegetables that Children Dislike – Fun and Engaging
RJ0600069_24
- Last Update 07/08/2025
- File Size 4.9MB
- # of Slides 2
- File Format PPTX
- Slide Ratio 16:9
- Color
Keywords
- #Content-Based Slides
- #Design-Based Slides
- #Product/Service Introduction
- #Market and Competitor Analysis
- #Diagram
- #Graph
- #Development Status
- #Competitive Advantage
- #Cluster
- #Circles
- #Inclusive Cluster Diagram
- #Doughnut Chart
- #16:9
- #doughnut chart PowerPoint
- #pie chart slide template
- #ratio comparison presentation
- #donut graph design
- #data visualization slides
About the Product
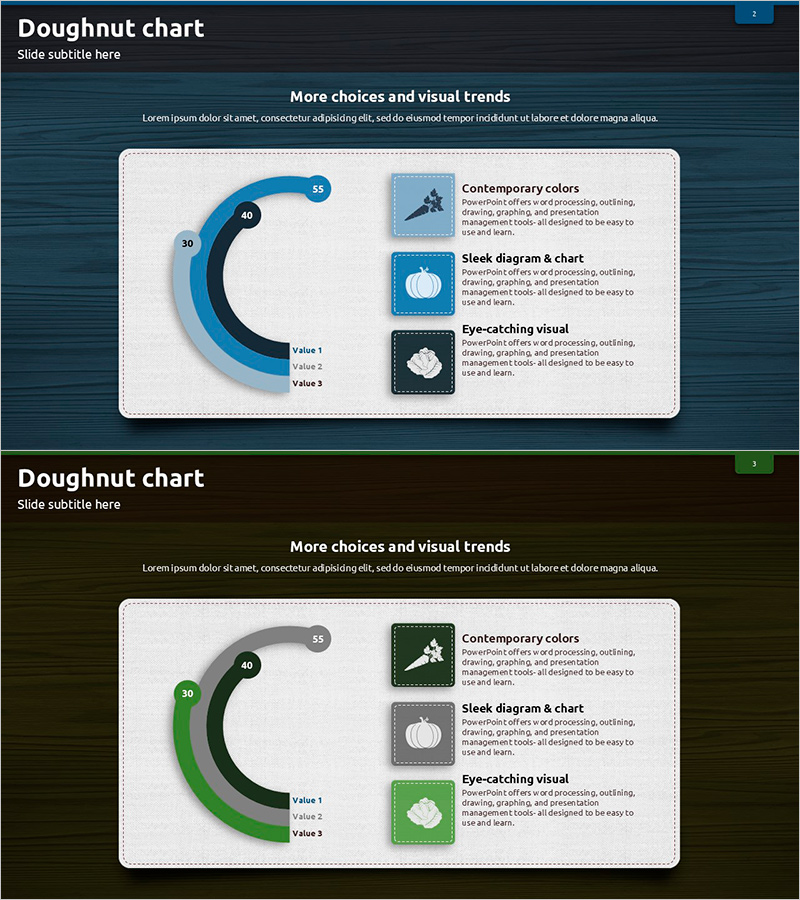
A 2-slide PowerPoint set visualizing the ratio of three items using a doughnut chart design. Features a gradient doughnut graph in blue, gray, and black tones positioned on the left, with corresponding text boxes on the right displaying item names, numerical values, and descriptions. The layout clearly shows data points and legend information, making it ideal for presenting market share, preference rankings, and composition ratios. Created in 16:9 widescreen format and fully editable in PPTX format for immediate customization.
Usage Points
-
Main Usage
Visualize the proportion and composition of three data categories using a doughnut chart, enabling audiences to instantly grasp the relative size of each segment against the whole. Numerical labels and legend ensure accurate data communication.
-
How to Use
Apply to market analysis, product preference surveys, customer demographic breakdowns, budget allocation presentations, and sales channel distribution reports. Add key metrics or titles in the doughnut center to emphasize critical data points.
-
Recommended For
Marketing strategy documents, business reports, market research presentations, financial analysis materials, and customer analytics slides. Ideal for executives, marketing teams, sales departments, and data analysts presenting data-driven insights.
-
Slide Structure
2-slide set. Each slide features a 3-segment gradient doughnut chart (blue, gray, black) on the left side with corresponding text boxes on the right showing item names, values, and descriptions. Includes title area at top and legend at bottom. 16:9 widescreen format.
Related Products
-

Cell Phone Development Status Analysis Chart – Competitive Advantage and Insights
#Product/Service Introduction #Market and Competitor Analysis #Diagram
-

Competitive Advantage Analysis Diagram – Drive to Market Success
#Product/Service Introduction #Market and Competitor Analysis #Diagram
-

Component Development Scale Pie Chart – Visualization of Competitive Advantage
#Product/Service Introduction #Market and Competitor Analysis #Graph
-

Drone Performance Comparison Analysis Graph – Data Visualization
#Product/Service Introduction #Market and Competitor Analysis #Graph
