Office Interior Enhancing Work Efficiency Slide
RJ0900029_17
- Last Update 08/25/2025
- File Size 1.2MB
- # of Slides 2
- File Format PPTX
- Slide Ratio 16:9
- Color
Keywords
- #Content-Based Slides
- #Design-Based Slides
- #Operational Plan
- #Market and Competitor Analysis
- #Diagram
- #Capital Investment Plan
- #Market Analysis
- #Table
- #Standard Table
- #16:9
- #table chart PowerPoint
- #data comparison slide template
- #6-row 4-column table
- #office interior presentation
- #efficiency analysis slides
About the Product
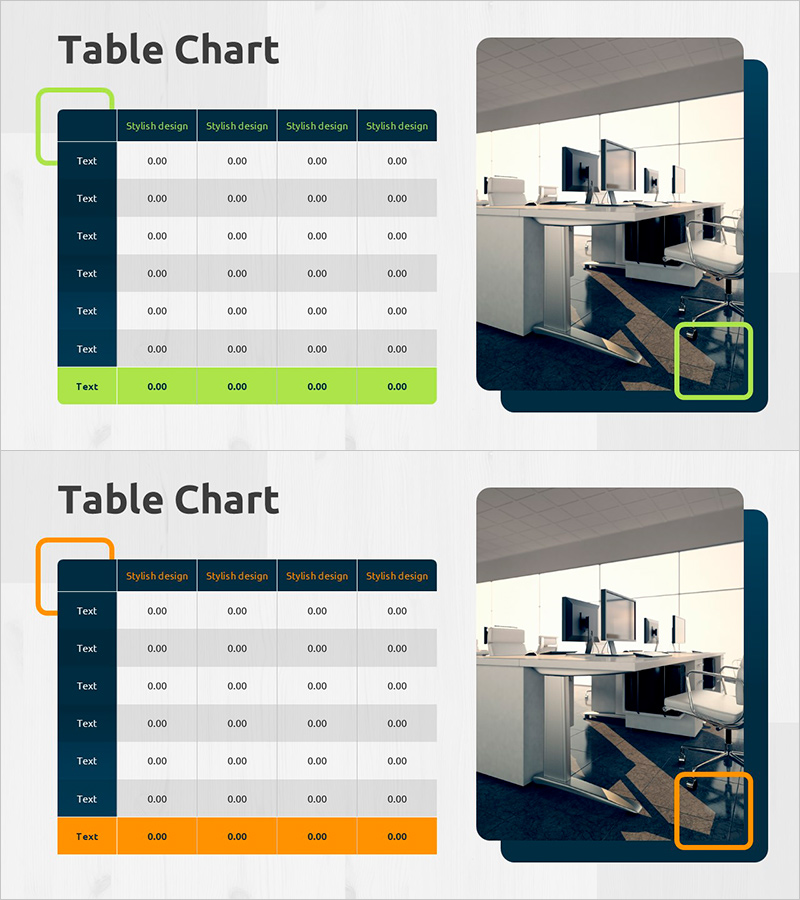
A table chart PowerPoint slide set featuring office interior and work efficiency themes. This 2-slide presentation includes two color variations with lime green and orange accent highlights. Each slide contains a 6-row by 4-column data entry table with a styled header row labeled 'Stylish design' and a highlighted footer row for emphasis. A text input area on the left allows for descriptive content, while an office environment mockup image on the right provides visual context. The structure is ideal for organizing numerical data, comparing items, and presenting performance metrics in professional business presentations.
Usage Points
-
Main Usage
Organize and visualize numerical data, performance indicators, and comparative information in a clear table format. Combined with the office environment mockup, it effectively communicates work efficiency metrics, operational status, market analysis results, and business performance data.
-
How to Use
Enter numerical values, text, percentages, or other data into each cell to populate the table. Select either the lime green or orange accent color version based on your presentation theme and corporate branding. Add analysis insights or conclusions in the left text area to reinforce the table's meaning and context.
-
Recommended For
Ideal for financial reports, business performance analysis, marketing campaign results, operational status presentations, and market research data summaries. Suitable for executives, planners, analysts, and sales professionals presenting data-driven insights and strategic decisions.
-
Slide Structure
Two-slide set with each slide featuring a 6-row by 4-column table structure. The header row uses dark navy background with white text, data rows have light gray backgrounds, and the footer row is highlighted in either lime green or orange. Left side includes a text input area, right side displays an office mockup image, creating balanced information and visual hierarchy.
Related Products
-

Automobile Market Export Volume Visualization Slide – Market Analysis and Strategy
#Market and Competitor Analysis #Marketing Plan and Strategy #Diagram
-

Table Chart Related to Space Industry – Insights from Market Analysis
#Market and Competitor Analysis #Diagram #Market Analysis
-

Goal Setting & Radial Graph – Intuitive Data Visualization
#Business Introduction #Market and Competitor Analysis #Diagram
-

Performance Analysis 3D Bar Chart & Table – Market and Performance Analysis
#Company Introduction #Market and Competitor Analysis #Diagram
