Visualizing Product Sales Performance and Future Outlook with Horizontal Bar Chart
RJ0900029_15
- Last Update 08/25/2025
- File Size 0.9MB
- # of Slides 2
- File Format PPTX
- Slide Ratio 16:9
- Color
Keywords
- #Content-Based Slides
- #Design-Based Slides
- #Business Strategy
- #Financial Plans and Performance
- #Graph
- #Financial Outlook & Expected Impact
- #Sales and Revenue
- #Column
- #Grouped Column
- #16:9
- #horizontal bar chart PowerPoint
- #bar graph slide template
- #sales performance visualization
- #3-series chart
- #data comparison slide
About the Product
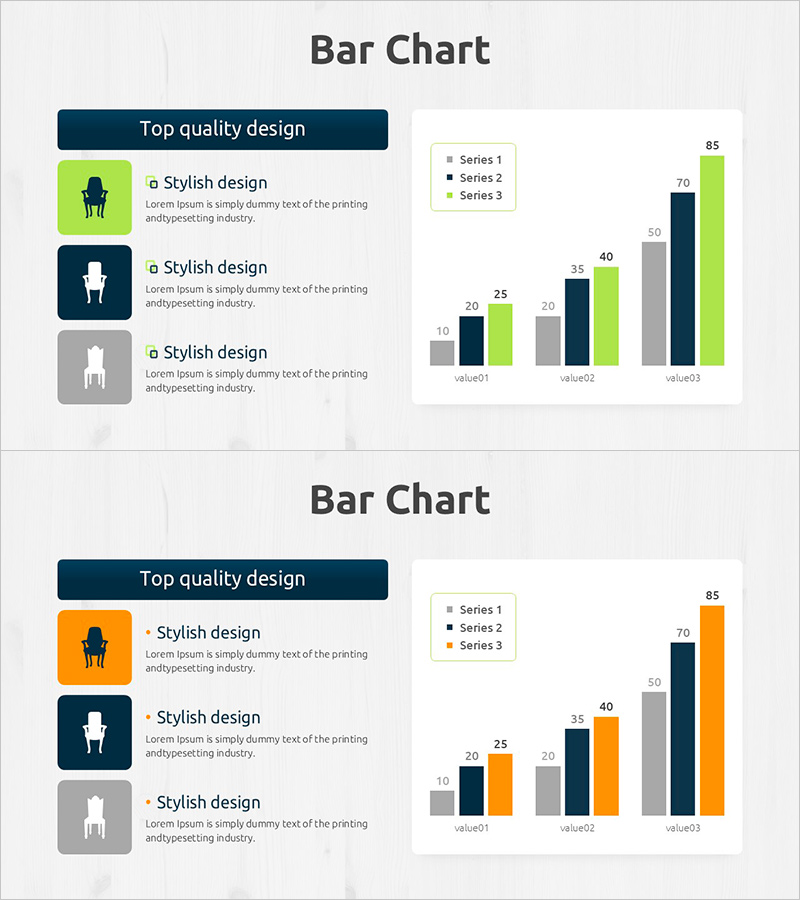
A PowerPoint slide template that visualizes product sales performance and future outlook using a 3-series horizontal bar chart. Three color-coded bars—lime green, dark navy, and orange—clearly compare numerical values across three data points (value01 to value03). The left side features three chair silhouettes paired with stylish descriptive text to emphasize key messages. Formatted in 16:9 aspect ratio with 2 slides, this presentation template is ready to use in financial reports, business plans, and marketing proposals for performance analysis sections.
Usage Points
-
Main Usage
Optimized for comparing and analyzing three or more data series—such as product sales figures, market share, or quarterly revenue—in a horizontal layout. Bar length intuitively conveys numerical differences, while the legend clearly distinguishes each series.
-
How to Use
Insert into the performance analysis section of financial reports, sales forecast pages in business plans, or competitive comparison slides in marketing proposals. Modify the left-side icons and text areas to add your message, then update bar values with actual data.
-
Recommended For
Ideal for finance, marketing, and sales teams presenting performance reports and forecasts. Suitable for executive briefings, investor presentations, and internal performance-sharing meetings where quantitative data must be emphasized.
-
Slide Structure
One horizontal bar chart per slide. Each chart contains 3 series (Series 1, 2, 3) and 3 data points (value01–value03) with numerical labels displayed above bars. The left side includes 3 colored background boxes with icon and text areas for adding explanatory content.
Related Products
-

Simple PPT Wide Template Vertical Bar Chart
#Business Strategy #Financial Plans and Performance #Graph
-

(Orange & Green) Bundle Chart and Future Outlook
#Business Strategy #Financial Plans and Performance #Graph
-

Leather Material Map Template - Global Network Visualization
#Company Introduction #Financial Plans and Performance #Graph
-

Four Color Infographic Bar Chart Presentation Template for Financial Analysis
#Market and Competitor Analysis #Financial Plans and Performance #Graph
