Travel Destination Infographic Market Share – Intuitive Data Visualization
RJ0600030_14
- Last Update 06/28/2025
- File Size 1.5MB
- # of Slides 2
- File Format PPTX
- Slide Ratio 16:9
- Color
Keywords
About the Product
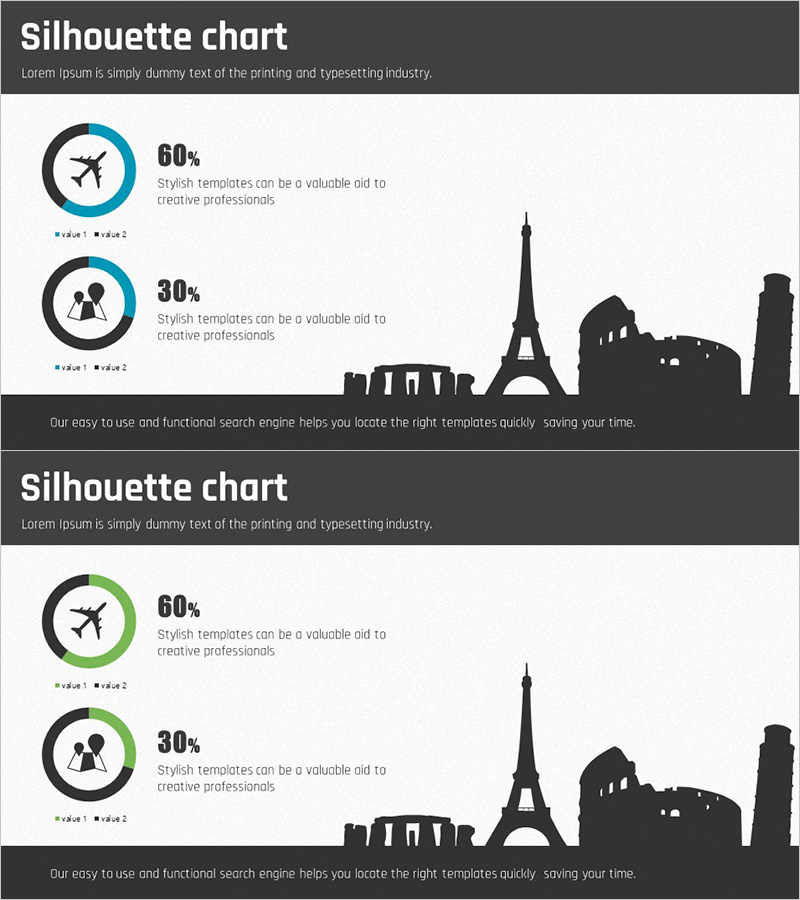
A 2-slide PowerPoint presentation featuring donut charts to visualize travel destination market share data. The slides use dual-tone blue and green circular graphs to intuitively represent percentage distributions, with each segment labeled with percentages and descriptive text. World landmark silhouettes including the Eiffel Tower and Colosseum are incorporated as background elements, making this template ideal for travel, tourism, and hospitality industry presentations. Available in 16:9 widescreen PPTX format, fully editable and ready to adapt for marketing reports, business analysis, and market share presentations.
Usage Points
-
Main Usage
Clearly express part-to-whole relationships such as market share, customer distribution, and sales ratios in the travel, tourism, and marketing sectors using donut-shaped circular graphs. Two slide layouts support comparative analysis and sequential explanations in business presentations.
-
How to Use
Double-click the donut chart data on each slide to modify percentage values and category labels with your own information. Blue and green colors can be adjusted via theme color settings to match corporate branding, and background landmark silhouettes can be removed or replaced with alternative imagery as needed.
-
Recommended For
Travel agencies, tourism boards, airlines, and hotel chains; marketing teams presenting market analysis; business reports requiring ratio data visualization; investor presentations on market conditions; educational seminars and training sessions explaining statistical information.
-
Slide Structure
Both slides follow identical layout structure. Each slide features two donut charts on the left side (displaying 60% and 30% proportions respectively), with world landmark silhouettes on the right (Eiffel Tower, Colosseum, Big Ben, etc.). Title area at top, descriptive text area at bottom for information hierarchy.
Related Products
-

Donut Chart Slide for Furniture Preferences Survey
#Market and Competitor Analysis #Graph #Market Share
-

Red Market Share Slide – Compelling Donut Chart Design
#Market and Competitor Analysis #Graph #Market Share
-

Doughnut Chart Slide Visualizing Market Share by Country
#Market and Competitor Analysis #Graph #Other
-

Analyzing Market Share with 3 Donut Charts and Tables
#Market and Competitor Analysis #Diagram #Graph
