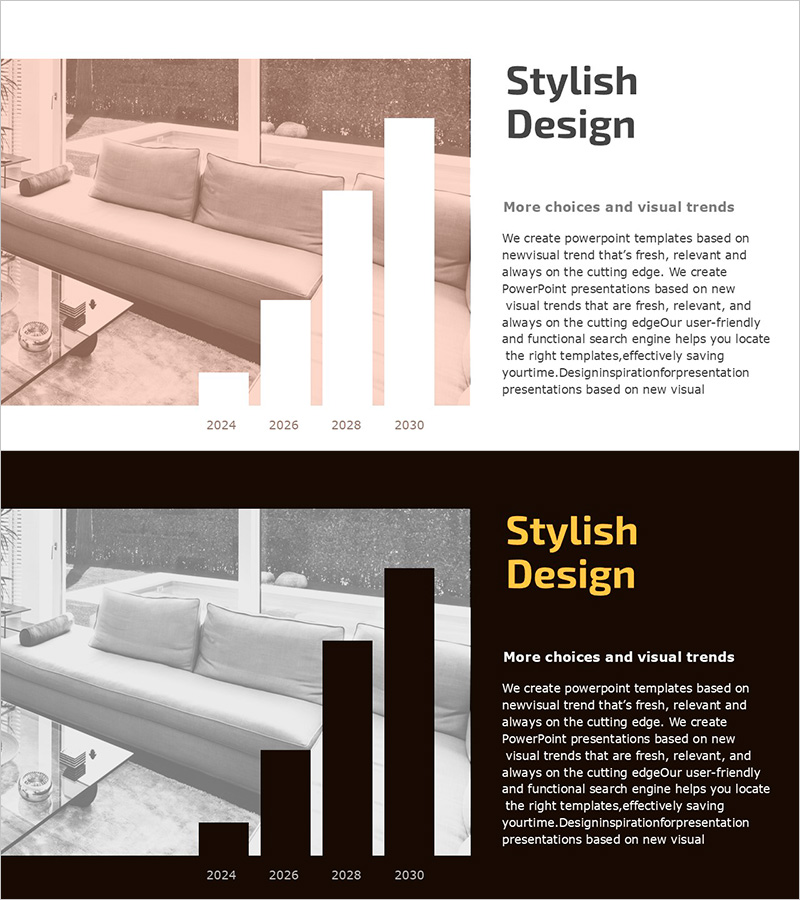
Elevation Graph Above Sofa Image - Visualizing Business Growth
RJ0900028_7
- Last Update 08/24/2025
- File Size 1.2MB
- # of Slides 2
- File Format PPTX
- Slide Ratio 16:9
- Color
Keywords
- #Content-Based Slides
- #Design-Based Slides
- #Business Strategy
- #Market and Competitor Analysis
- #Graph
- #Financial Outlook & Expected Impact
- #Future Outlook
- #Column
- #Column Chart
- #16:9
- #ascending bar chart PowerPoint
- #growth trend visualization slide
- #business growth chart template
- #4-year bar graph PowerPoint
- #how to create growth chart in PowerPoint
About the Product
A 2-slide PowerPoint template that visualizes business growth trends with clarity and impact. Four ascending bars representing years 2024 through 2030 are positioned over a warm beige and pink sofa image background, ideal for displaying revenue growth, customer acquisition, or market expansion metrics. Two color variations—light and dark backgrounds—are included to match your presentation theme and brand identity. Perfect for business proposals, quarterly reports, and strategic presentations where data-driven growth narratives need strong visual support.
Usage Points
-
Main Usage
Communicate year-over-year or quarter-over-quarter growth metrics—revenue, customer count, market share—to executives, investors, and team members through a visually compelling ascending bar structure that emphasizes upward momentum.
-
How to Use
Insert into business plans, investor pitch decks, quarterly performance reports, or strategic planning presentations. Edit bar heights and data labels to reflect actual figures, and select the background color version that aligns with your presentation theme.
-
Recommended For
C-suite executives, finance teams, marketing departments, and sales teams presenting growth metrics; startups demonstrating scalability to investors; consulting firms reporting client performance outcomes.
-
Slide Structure
2-slide set: Slide 1 features light beige-pink background with sofa image and 4 ascending bars (2024–2030); Slide 2 offers dark background variant. Each bar is independently editable; legend and numeric labels can be customized.
Related Products
-

Growth Prospects Graph – Business Strategy Development
#Business Strategy #Market and Competitor Analysis #Graph
-

Future Outlook Vertical Bar Graph – Business Strategy Analysis
#Business Strategy #Market and Competitor Analysis #Graph
-

Utilization Rate of Oriental Medicine Clinics by Age – Market and Competitor Analysis
#Business Strategy #Market and Competitor Analysis #Graph
-

Denim PPT Vertical Bar Graph Analysis – Market and Competitor Analysis
#Business Strategy #Market and Competitor Analysis #Graph
