Bar Graph for Surveying Life Satisfaction by Environment
RJ0900028_39
- Last Update 08/24/2025
- File Size 0.9MB
- # of Slides 2
- File Format PPTX
- Slide Ratio 16:9
- Color
Keywords
About the Product
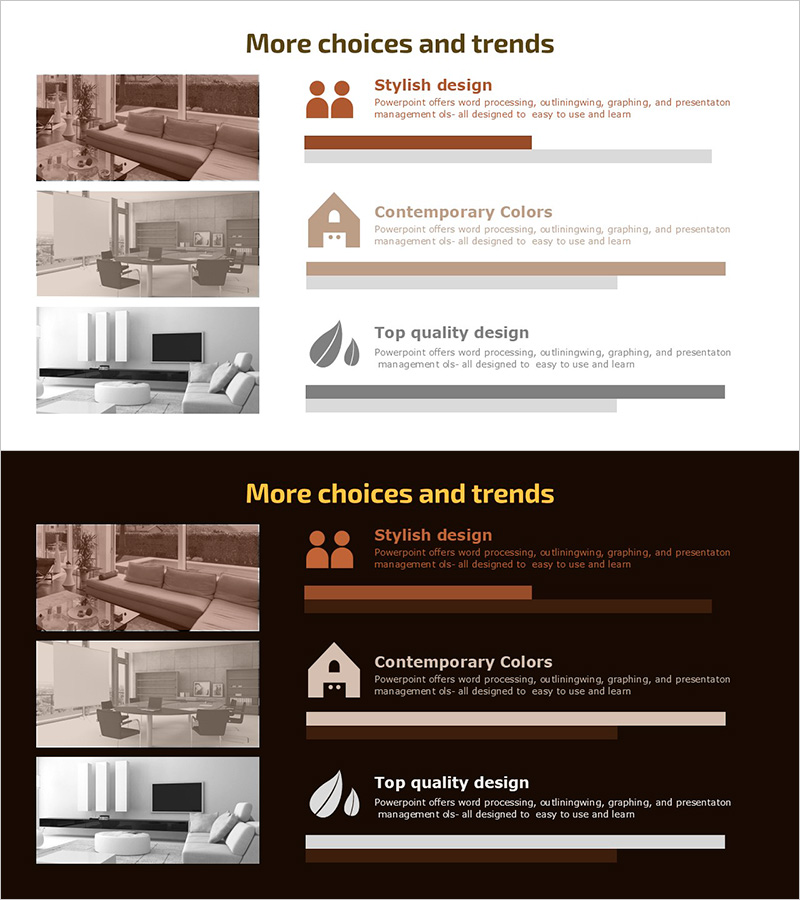
A horizontal bar chart PowerPoint slide comparing life satisfaction across five environmental categories with dual-tone visualization. The design uses brown accent bars for actual values and gray background bars for target or comparative values, enabling clear side-by-side analysis of data gaps. This 2-slide PPTX template (16:9 aspect ratio) is ready for immediate use in market research presentations, environmental impact assessments, and customer satisfaction reports. All data fields and colors are fully editable to match your specific survey results.
Usage Points
-
Main Usage
This slide quantitatively compares life satisfaction levels across environmental conditions and highlights item-by-item performance gaps. It serves as a core visualization tool for market research presentations, environmental policy assessments, and customer satisfaction analyses, enhancing data credibility and audience comprehension.
-
How to Use
Replace the bar lengths and numerical values with your actual survey data. Assign the brown bars to current performance metrics and gray bars to target benchmarks or comparison groups to emphasize differences. Present each item sequentially during your talk to maintain audience focus and guide interpretation of the data.
-
Recommended For
Market researchers, environmental policy planners, marketing analysts, social science researchers, and business executives preparing reports. Ideal for quantitative comparative analysis in research reports, academic presentations, and executive briefings where data-driven credibility is essential.
-
Slide Structure
Two-slide layout featuring a horizontal bar chart with five categories (e.g., housing, education, health, economy, environment). Each category displays a brown primary bar (actual value) and gray background bar (target value) side-by-side for direct comparison. The second slide provides space for detailed explanations or supplementary data annotations.
Related Products
-

Segmented Bar Graph for Market & Competitor Analysis – Simple Theme
#Market and Competitor Analysis #Graph #Competitor Analysis
-

Target Country Analysis Chart – Data Visualization for Market Analysis
#Market and Competitor Analysis #Graph #Other
-

Blue Orange Segmentation Graph – Market and Competitor Analysis
#Market and Competitor Analysis #Graph #Competitor Analysis
-

Business Area Analysis Graph & PC Mockup
#Technical Approach #Market and Competitor Analysis #Graph
