Simple Donut Chart – Data Visualization with Sleek Design
RJ0900028_35
- Last Update 08/24/2025
- File Size 0.7MB
- # of Slides 2
- File Format PPTX
- Slide Ratio 16:9
- Color
Keywords
About the Product
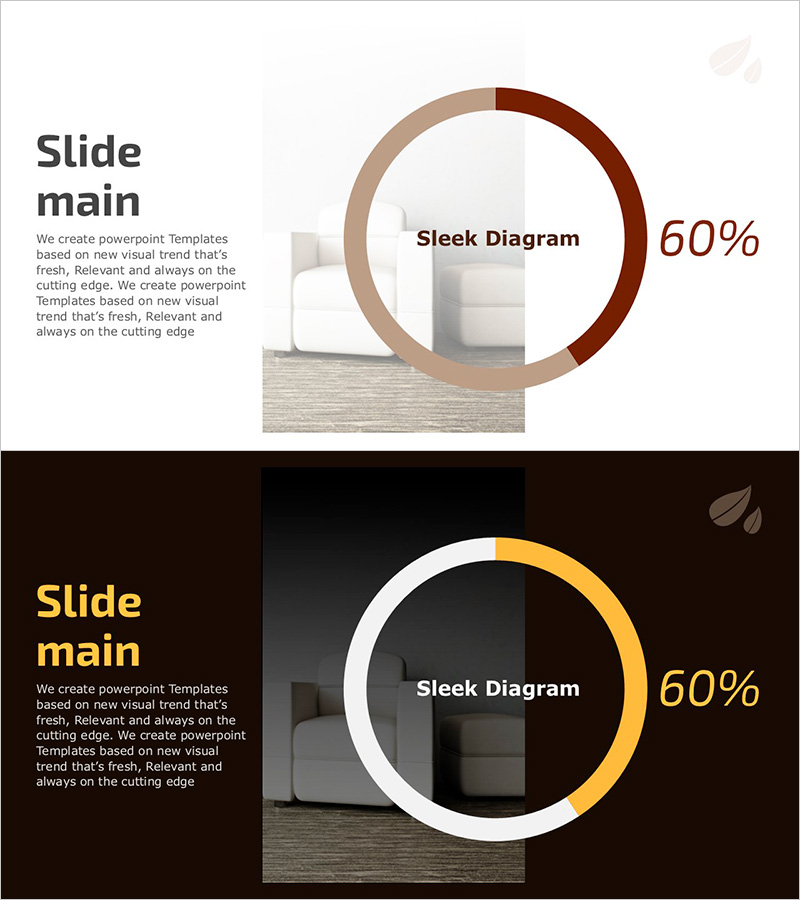
A 2-slide donut chart PowerPoint template featuring gradient ring visualization in brown, beige, and white tones. Each slide displays a 60% ratio representation with two design versions: one on a light background and one on a dark background. The donut chart format allows central space for additional text, labels, or key metrics while emphasizing data proportions. Ideal for presenting market share, performance metrics, budget allocation, and composition ratios in business presentations. Ready-to-edit slides for immediate use in your PowerPoint deck.
Usage Points
-
Main Usage
Visualize proportional data using donut chart format to represent market share, sales performance, budget distribution, and composition percentages. The hollow center allows placement of key figures, percentages, or legend information to enhance data communication.
-
How to Use
Insert into the analysis, results, or statistics section of your presentation. Use the light background version for standard presentations and the dark background version for evening events or premium-themed documents. Edit chart values and labels with your own data and insert directly into your slide deck.
-
Recommended For
Marketing professionals, financial analysts, business planners, and sales presenters who need to display market analysis, sales status, budget breakdown, and customer composition. Suitable for investor presentations, quarterly performance reports, business plan pitches, and strategic reviews.
-
Slide Structure
Two-slide set with identical donut chart structure in different color schemes. Slide 1: light background with brown-beige gradient donut (60% emphasis). Slide 2: dark background with white-gold gradient donut. Both slides feature a two-column layout with text area on the left and chart on the right.
Related Products
-

Horizontal Bar Graph for Competitor Analysis – Effective Data Visualization
#Market and Competitor Analysis #Graph #Competitor Analysis
-

User Gender Ratio Analysis Graph – Visualizing Market Share
#Market and Competitor Analysis #Graph #Customer Analysis
-

User Gender Ratio Analysis Graph – Customer Insights
#Market and Competitor Analysis #Graph #Customer Analysis
-

Line Chart & Table – Market and Competitor Analysis
#Market and Competitor Analysis #Diagram #Graph
