Market Analysis Horizontal Bar Chart – Competitor Analysis
RJ0400011_8
- Last Update 05/20/2025
- File Size 0.3MB
- # of Slides 2
- File Format PPTX
- Slide Ratio 16:9
- Color
Keywords
- #Content-Based Slides
- #Design-Based Slides
- #Market and Competitor Analysis
- #Graph
- #Market Analysis
- #Horizontal Bar
- #Horizontal Bar Chart
- #16:9
- #horizontal bar chart PowerPoint
- #competitor analysis slide
- #market analysis presentation
- #bar graph template download
- #business data visualization PowerPoint
About the Product
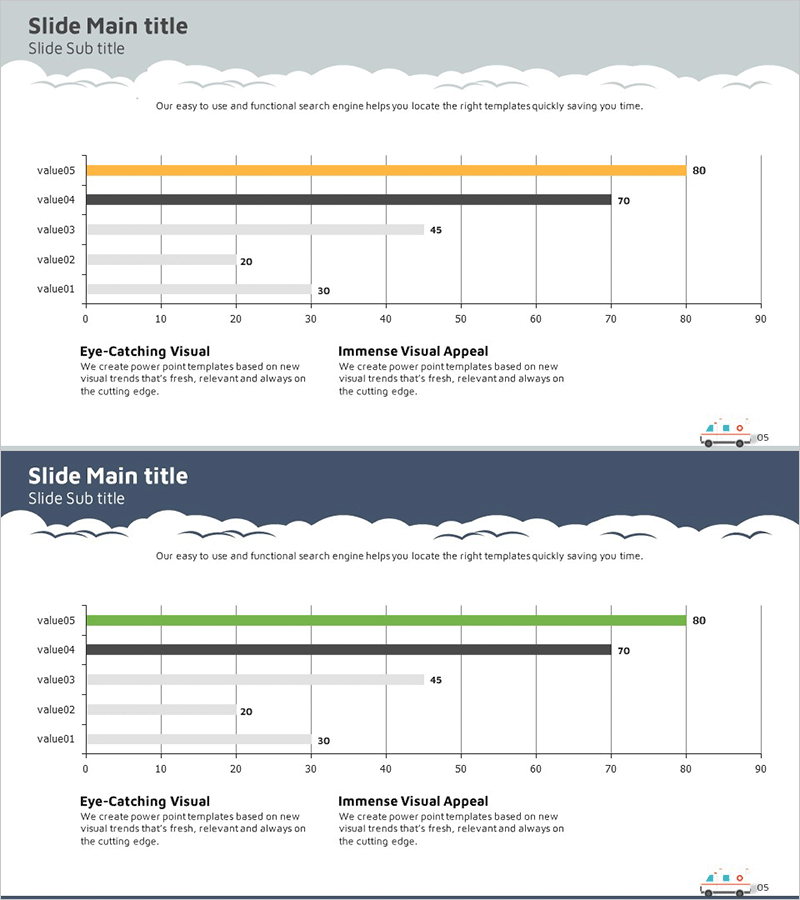
A horizontal bar chart PowerPoint slide optimized for market analysis and competitor benchmarking. The design uses contrasting orange and gray color schemes to clearly represent five data points, with a grid background that enhances data readability. The 2-slide set provides consistent layout variations for unified visual presentation throughout your business deck. Ideal for marketing reports, strategy meetings, investor presentations, and competitive analysis slides that require quantitative data visualization.
Usage Points
-
Main Usage
Displays market analysis and competitor comparison data quantitatively. The horizontal bar layout presents five data points side-by-side for intuitive size comparison, while the orange accent and gray background series create visual hierarchy to emphasize key metrics.
-
How to Use
Use in marketing strategy meetings, business reports, investor pitches, and competitive analysis presentations to show competitor performance metrics, market share, pricing comparisons, or customer satisfaction scores. Double-click values and labels to edit instantly; modify colors via the theme color palette.
-
Recommended For
Marketing managers, strategy planners, sales executives, consultants, and financial analysts presenting competitive landscape analysis, market status reports, and performance comparisons. Particularly effective for B2B presentations requiring objective, data-driven competitive positioning.
-
Slide Structure
Each slide contains a title area, a 5-item horizontal bar chart, axis labels (0–90 range), and legend text. Data is represented by orange bars (maximum value 80) and gray bars (70, 45, 20, 30) with value01–value05 labels. Both slides share identical structure with color variation options for flexible design application.
Related Products
-

Diet Preference Graph – A Tool for Market Analysis
#Market and Competitor Analysis #Graph #Market Analysis
-

Circular Highlight Bar Graph – Optimal for Market and Competitor Analysis
#Market and Competitor Analysis #Graph #Competitor Analysis
-

Market Demand Analysis PowerPoint Slide – Donut Chart Layout
#Market and Competitor Analysis #Graph #Customer Analysis
-

Successful Business Future Outlook Analysis Graph
#Market and Competitor Analysis #Diagram #Graph
