Market Status and Competitor Analysis – Emphasized with Green and Navy
RJ0400014_11
- Last Update 05/21/2025
- File Size 0.1MB
- # of Slides 2
- File Format PPTX
- Slide Ratio 16:9
- Color
Keywords
- #Content-Based Slides
- #Design-Based Slides
- #Market and Competitor Analysis
- #Graph
- #Market Status
- #Competitor Analysis
- #Horizontal Bar
- #Grouped Horizontal Bar
- #16:9
- #grouped bar chart PowerPoint
- #horizontal bar graph template
- #year-over-year comparison slide
- #market analysis chart
- #competitor analysis PowerPoint slide template
About the Product
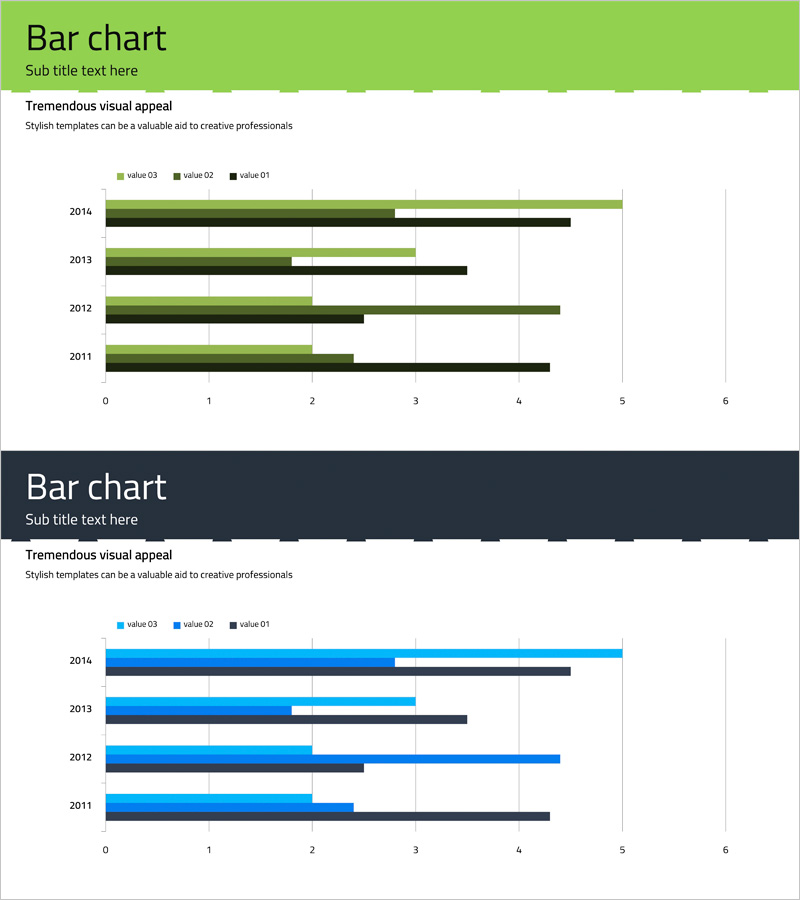
A grouped horizontal bar chart PowerPoint slide designed for market status and competitor analysis presentations. This slide template features three data series in green and navy color schemes, comparing values across four years (2011–2014) in a side-by-side grouped bar layout. The 2-slide deck in 16:9 widescreen format includes title, subtitle, and descriptive text areas for seamless integration into your presentation narrative. Ideal for business reports, investor pitches, strategic planning sessions, and competitive positioning analyses where multi-series numerical comparisons drive decision-making.
Usage Points
-
Main Usage
Visualize multi-series numerical comparisons across time periods and categories to support market trend analysis and competitive positioning. The three-series grouped bar layout enables simultaneous comparison of performance metrics, market share, or KPIs across four years, making it ideal for executive briefings, investor presentations, and strategic planning meetings.
-
How to Use
Slide 1 displays the primary grouped bar chart with green, navy, and black series across four years; Slide 2 provides an alternative color variant. Replace axis labels, legend entries, and numerical values with your own data. Adjust bar colors, gridlines, and font sizes to match your corporate branding or presentation theme. Both slides maintain consistent structure for easy customization.
-
Recommended For
Executive and C-suite quarterly or annual performance reports, marketing team market share and competitive analysis presentations, sales team competitive benchmarking decks, strategic planning team portfolio review meetings, and investor relations materials covering market landscape and competitive positioning sections.
-
Slide Structure
2-slide template. Each slide features a title area (green header bar), subtitle text, horizontal axis (0–6 scale), vertical axis (years 2011–2014), three grouped data series bars (green, navy, black), and legend. Optimized for 16:9 widescreen format to fit modern presentation environments and large-screen displays.
Related Products
-

Detailed Bundled Bar Chart – Market and Competitor Analysis
#Market and Competitor Analysis #Graph #Market Status
-

Medical Record Analysis Bar Graph – Market and Competitor Analysis
#Market and Competitor Analysis #Graph #Competitor Analysis
-

Slide Emphasizing Social Service Strengths through Competitive Analysis
#Market and Competitor Analysis #Graph #Text Box
-

Future Outlook Analysis Graph – Market and Competitive Analysis
#Market and Competitor Analysis #Graph #Other
