Analysis Graph of Future Prospects for Cooperative Business
RJ0300097_25
- Last Update 05/16/2025
- File Size 0.3MB
- # of Slides 2
- File Format PPTX
- Slide Ratio 16:9
- Color
Keywords
- #Content-Based Slides
- #Design-Based Slides
- #Market and Competitor Analysis
- #Diagram
- #Graph
- #Future Outlook
- #Market Analysis
- #Column
- #Segmented Column
- #16:9
- #vertical bar chart PowerPoint
- #stacked bar graph slide
- #multi-series data comparison
- #year-over-year trend chart
- #3-series cumulative bar chart PowerPoint template
About the Product
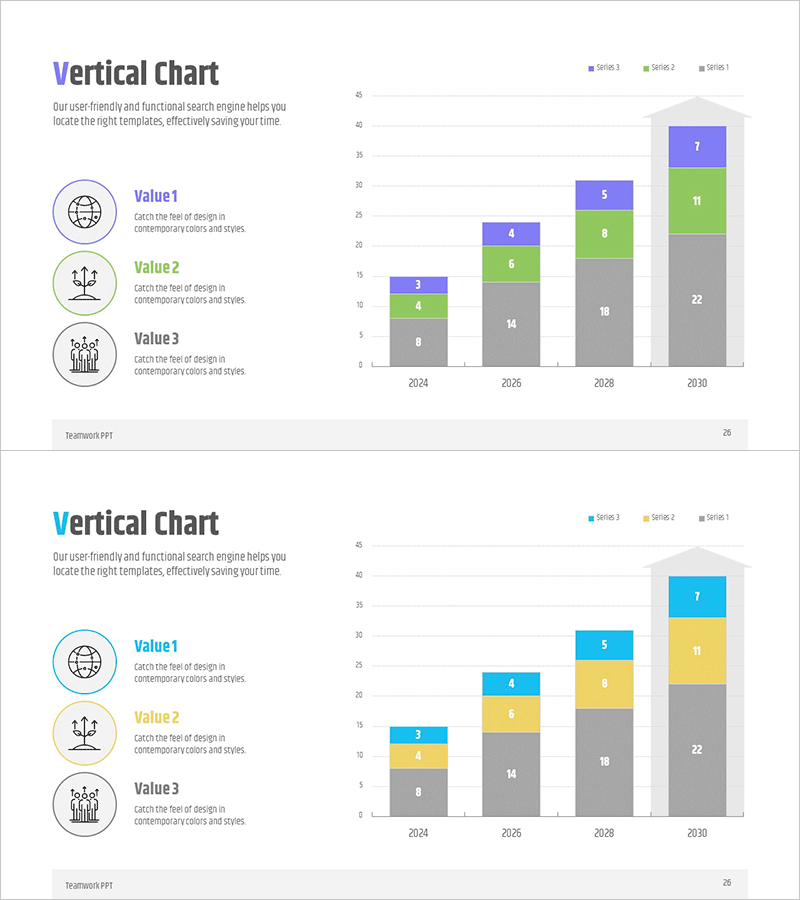
A vertical bar chart PowerPoint slide that clearly visualizes year-over-year data changes across multiple series. This presentation slide displays data from 2024 to 2030 with three distinct series (Series 1, 2, and 3), allowing viewers to compare cumulative values for each year at a glance. The left side features three descriptive icons with text areas to explain the meaning of each data series. The color scheme uses blue, green, and gray tones to differentiate the series, making it ideal for business reports, market analysis presentations, and executive briefings that require multi-series data visualization.
Usage Points
-
Main Usage
Use this slide to compare data changes across time periods with three or more data series. It effectively displays numerical trends such as revenue, customer count, or market share, allowing simultaneous visualization of relative magnitudes and directional changes across all series.
-
How to Use
Enter the meaning of each series in the left icon area (e.g., Sales, Costs, Profit), then replace the chart values with your actual data. You can adjust the number of series if needed while maintaining the color scheme, and modify year labels and legend text to match your presentation context.
-
Recommended For
Ideal for financial reports, business plans, market analysis documents, quarterly performance presentations, and executive briefings where multi-indicator trends over time need explanation. Particularly effective for presentations to executives, investors, and stakeholders requiring comparative analysis.
-
Slide Structure
Two-slide set with each slide divided into a left explanation area (3 icons with text) and right chart area. The vertical bar chart displays 4 years (2024, 2026, 2028, 2030) × 3 series structure, with Y-axis range 0-45 and legend included.
Related Products
-

Market Analysis Segmented Bar Graph & Table Chart – Visualization of Competitive Analysis
#Market and Competitor Analysis #Diagram #Graph
-

Orange Purple Subdivided Graph Table – Visualizing Market Data
#Market and Competitor Analysis #Diagram #Graph
-

100% Stacked Column Chart by Subject – Effective Market Analysis
#Market and Competitor Analysis #Diagram #Graph
-

Successful Business Future Outlook Analysis Graph
#Market and Competitor Analysis #Diagram #Graph
