Galaxy Theme Market Analysis Donut Circle Graph
RJ0400001_14
- Last Update 05/17/2025
- File Size 13.8MB
- # of Slides 2
- File Format PPTX
- Slide Ratio 16:9
- Color
Keywords
About the Product
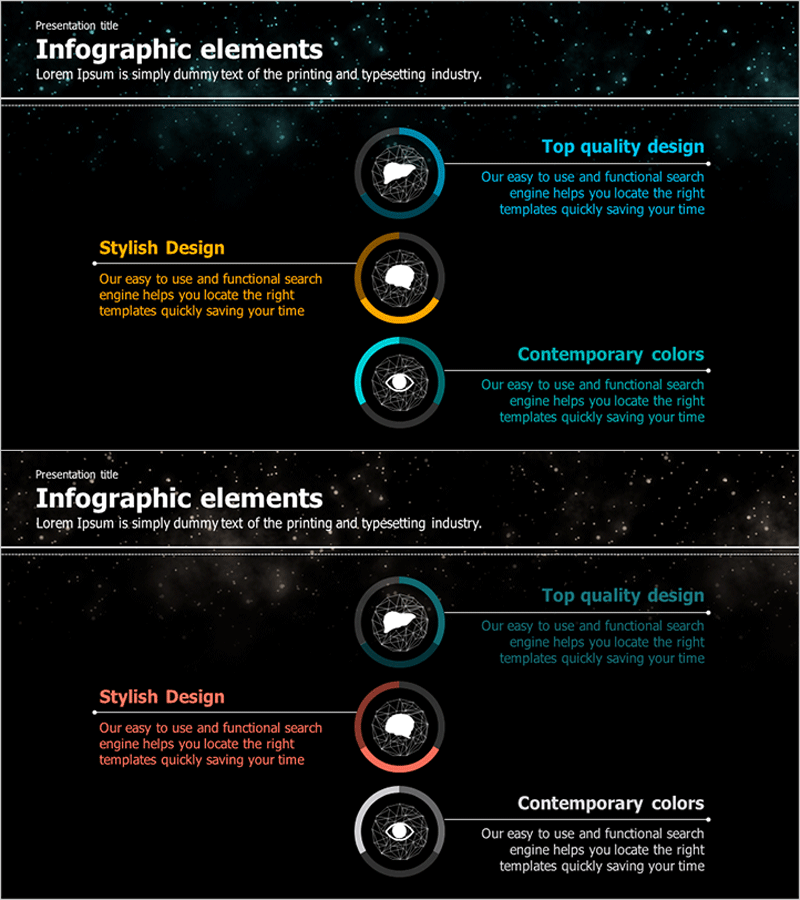
A donut circle graph PowerPoint slide featuring a dark galaxy-themed background with three color-coded rings in cyan, orange, and teal. Each segment includes icons and descriptive text to visually represent market share, competitive comparison, customer composition, and other proportional data. The 2-slide set provides layout variations optimized for 16:9 widescreen format. All segment labels, percentages, and descriptions are fully editable, making it ready for immediate use in market analysis presentations, competitive positioning reports, and stakeholder briefings.
Usage Points
-
Main Usage
Ideal for displaying market share, competitive ratios, customer segmentation, revenue composition, and other part-to-whole relationships across 3–4 categories. The donut ring structure allows central placement of key metrics or titles, creating clear information hierarchy.
-
How to Use
Insert your market analysis data into each segment, adjust ring colors as needed, and customize labels and percentages. The dark galaxy background with color-coded rings conveys professionalism, making it suitable for executive reports, investor pitches, and board presentations.
-
Recommended For
Marketing managers, strategic planners, financial analysts, business development professionals. Ideal for market research findings, competitive landscape analysis, customer portfolio composition, revenue segment breakdown, and business unit performance reviews.
-
Slide Structure
2-slide set with concentric donut rings centered on a circular icon. Each slide features 3 color-coded segments (cyan, orange, teal) with dedicated label and data entry areas. Title text area on the left, descriptive text area on the right, optimized for 16:9 widescreen display.
Related Products
-

Visual Insights on Education Analysis PowerPoint
#Market and Competitor Analysis #Diagram #Graph
-

Donut Chart Visualizing Merchandise Sales Proportion
#Market and Competitor Analysis #Graph #Market Share
-

Shareholder Status Distribution Analysis Chart – Visualizing Shareholder Information
#Company Introduction #Market and Competitor Analysis #Diagram
-

Paint Splash Bar Chart Template – Market Analysis and Strategy
#Market and Competitor Analysis #Marketing Plan and Strategy #Graph
