Slide Visualizing Data with Simple Mat Lab Graph
RJ0900028_32
- Last Update 08/24/2025
- File Size 0.5MB
- # of Slides 2
- File Format PPTX
- Slide Ratio 16:9
- Color
Keywords
About the Product
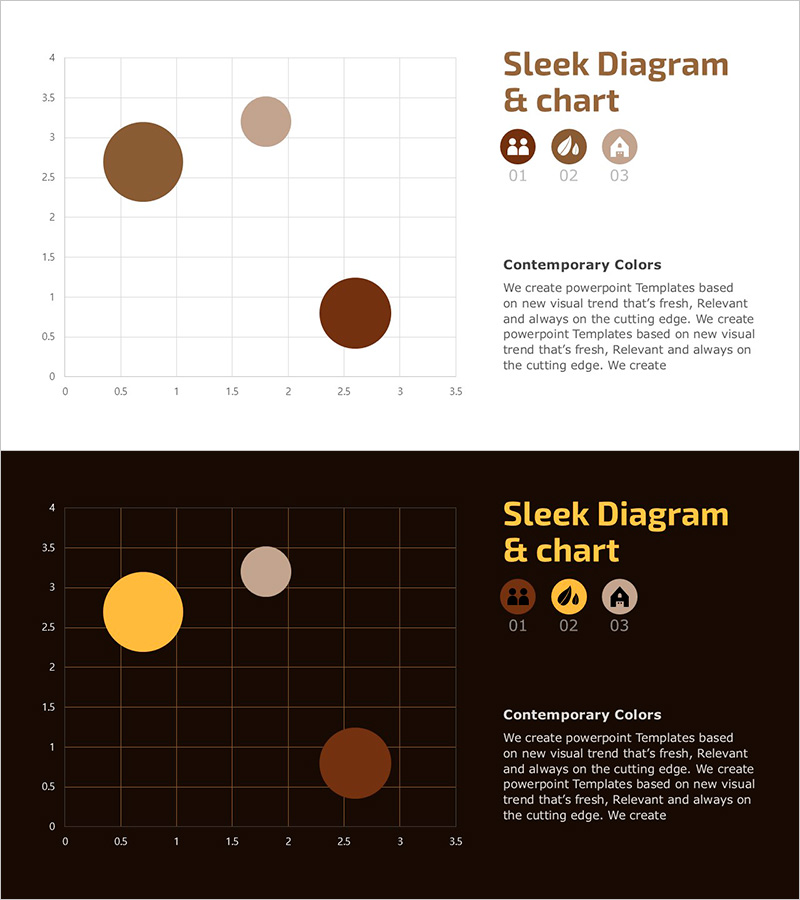
A 2-slide PowerPoint presentation featuring scatter plot charts for multi-variable data visualization. Each slide displays three data points positioned on a coordinate axis system with different sizes and colors (brown, beige, dark brown) to represent multiple data series. The template includes both light and dark background versions, with grid lines for precise value reading. Ideal for quantitative analysis, research findings, and business intelligence presentations where correlation and distribution patterns need clear visual representation.
Usage Points
-
Main Usage
Visualizes relationships and distribution patterns between multiple quantitative variables. Scatter plots reveal correlations, clusters, and outliers at a glance, making them essential for business analytics, market research, scientific presentations, and performance reporting where multi-dimensional data comparison is critical.
-
How to Use
Replace the sample data points with your actual values by adjusting position and size on the coordinate grid. Edit axis ranges, labels, and legend text to match your dataset. Customize point colors and transparency for emphasis. Use the light background version for print and projector presentations; select the dark background for large screens and virtual meetings.
-
Recommended For
Data analysts, statisticians, market research teams, academic presenters, and management consultants presenting quantitative findings. Particularly suited for correlation analysis, market segmentation, customer behavior patterns, performance metrics comparison, and any report requiring multi-variable data representation.
-
Slide Structure
Two-slide layout with standard coordinate system (0–3.5 range on both axes) featuring grid lines for reference. Three circular data points of varying sizes positioned to show distribution and relationships. Title and description text area positioned on the right side. Three icons (people, leaf, building) serve as legend indicators for data series identification.
Related Products
-

Bar Graph of Progress Analysis by Task - Effective Visualization of Progress
#Product/Service Introduction #Market and Competitor Analysis #Marketing Plan and Strategy
-

Service Analysis Line Graph – Visualization of Competitive Advantage
#Market and Competitor Analysis #Diagram #Graph
-

Light Bulb Graph for Market Trends – Future Oriented
#Market and Competitor Analysis #Graph #Future Outlook
-

Market Demand Analysis PowerPoint Slide – Donut Chart Layout
#Market and Competitor Analysis #Graph #Customer Analysis
