Analysis of US Target Regions – Slide Template for Market and Competitor Analysis
RJ0300067_25
- Last Update 05/07/2025
- File Size 1.1MB
- # of Slides 2
- File Format PPTX
- Slide Ratio 16:9
- Color
Keywords
- #Content-Based Slides
- #Design-Based Slides
- #Market and Competitor Analysis
- #Graph
- #Other
- #Market Analysis
- #Target Market
- #Other
- #Other Charts
- #Map
- #16:9
- #US map PowerPoint slide
- #regional analysis presentation template
- #target market map
- #market analysis PPT
- #geographic data visualization PowerPoint
About the Product
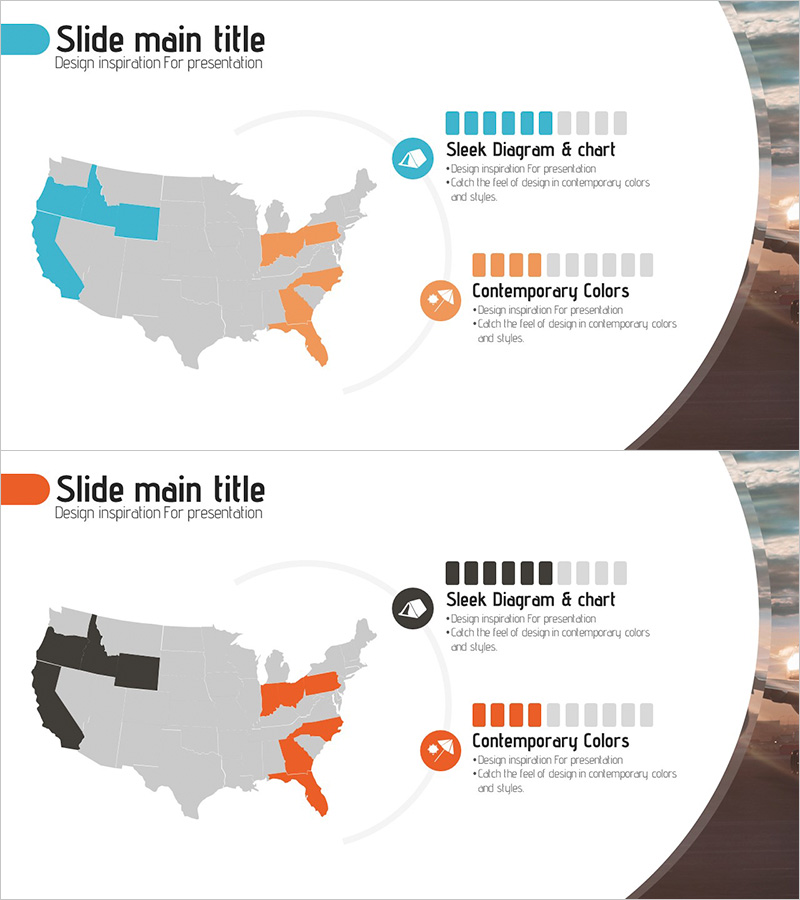
A comprehensive US map-based PowerPoint slide set for analyzing target regions and market opportunities. The two-slide template uses a dual-tone color scheme of teal and orange to highlight specific states, enabling clear visualization of market entry strategies, competitive positioning, and regional sales analysis. Formatted in 16:9 widescreen PPTX, these slides integrate seamlessly into business presentations, market reports, and investor pitch decks. Each slide features customizable state highlighting, allowing you to represent multiple scenarios such as current market presence, target expansion regions, and competitor market share in a single presentation.
Usage Points
-
Main Usage
Visualize US market entry strategies, regional sales performance, and competitive landscape analysis through geographic mapping. The teal and orange color differentiation enables simultaneous representation of target regions and comparison areas, making complex market data immediately comprehensible.
-
How to Use
Insert into the market analysis section of marketing strategy decks, regional strategy pages of business reports, and market opportunity analysis slides of investor presentations. Modify state colors on each slide to represent different scenarios: current market presence, target expansion zones, and competitor market penetration.
-
Recommended For
Marketing managers, business development professionals, executive reporting teams, and investor relations specialists presenting region-based strategies. Particularly effective for US market analysis, franchise expansion planning, distribution network development, and geographic market segmentation presentations.
-
Slide Structure
Two-slide set, each featuring a complete US map with gray base coloring. Teal highlighting indicates 2–3 primary target states, while orange highlighting shows 2–3 secondary or competitive regions. A legend and text annotation area on the right side accommodates key data points. 16:9 widescreen format ensures compatibility with modern presentation environments.
Related Products
-

Country Analysis Map Graph for Market Insights
#Market and Competitor Analysis #Marketing Plan and Strategy #Graph
-

Horizontal Bar Chart Visualizing US Target Market Progress
#Market and Competitor Analysis #Graph #Other
-

Botanic Garden Wide PPT Map – A Visual Tool for Effective Market Analysis
#Market and Competitor Analysis #Diagram #Other
-

Target Country Year-by-Year Analysis Chart – Data Visualization for Market Analysis
#Market and Competitor Analysis #Graph #Other
