VR Market Analysis Bar Graph – Understanding Competitive Landscape
RJ0400065_12
- Last Update 06/05/2025
- File Size 4.7MB
- # of Slides 2
- File Format PPTX
- Slide Ratio 16:9
- Color
Keywords
- #Content-Based Slides
- #Design-Based Slides
- #Market and Competitor Analysis
- #Graph
- #Competitor Analysis
- #Market Analysis
- #Horizontal Bar
- #Segmented Horizontal Bar
- #16:9
- #horizontal bar chart PowerPoint
- #bar graph slide template
- #market analysis chart
- #year-over-year comparison
- #how to create bar chart in PowerPoint
About the Product
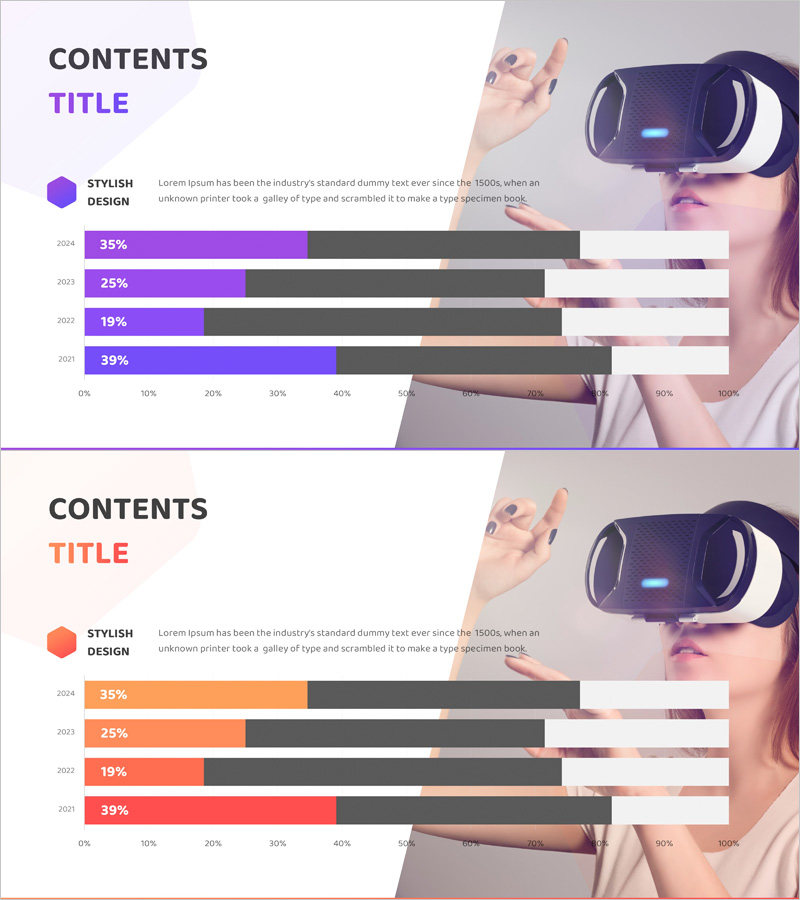
A horizontal bar chart PowerPoint slide optimized for VR market analysis and competitive landscape visualization. This presentation template displays data across four years (2021–2024) with a dual-tone color scheme combining purple and orange bars for clear year-over-year differentiation. Each bar extends from 0% to 100% on a horizontal scale, enabling intuitive ratio comparison with effective use of gray background spacing. The slide deck is ready for immediate use in business presentations, market research reports, and competitive analysis documents.
Usage Points
-
Main Usage
Compares numerical data such as market size, market share, and growth rates across multiple years in a horizontal layout. Effectively visualizes year-over-year trends and competitive performance differences at a glance, making complex data accessible to audiences.
-
How to Use
Insert into market analysis sections, competitive landscape slides, and business performance reports. Modify bar lengths and colors to match your actual data, and add custom legends and axis labels for clear information delivery and professional presentation impact.
-
Recommended For
Marketing professionals, business analysts, management consultants, and investment managers presenting market conditions and competitive positioning. Particularly suited for IT, VR/AR, and technology industry presentations and reports.
-
Slide Structure
Two-slide set with four horizontal bars per slide representing years 2021–2024. Purple-toned and orange-toned bars distinguish data series, with horizontal axis scaling from 0–100% and year labels included. Optimized for 16:9 widescreen format with balanced spacing and professional layout.
Related Products
-

Body Organ Analysis Subdivision Graph - Market and Competitor Comparison
#Market and Competitor Analysis #Graph #Competitor Analysis
-

Blue Green Subdivided Graph – Template for Market and Competitor Analysis
#Market and Competitor Analysis #Graph #Competitor Analysis
-

Market Analysis Graph Ahead of the Future – Innovative Business Insights
#Market and Competitor Analysis #Diagram #Graph
-

Space Industry Market Analysis Bar Graph – Providing Strategic Insights
#Market and Competitor Analysis #Graph #Competitor Analysis
