Visualizing Consumer Survey Results of Bathroom Remodeling with Doughnut Chart
RJ0900027_5
- Last Update 08/24/2025
- File Size 0.3MB
- # of Slides 2
- File Format PPTX
- Slide Ratio 16:9
- Color
Keywords
About the Product
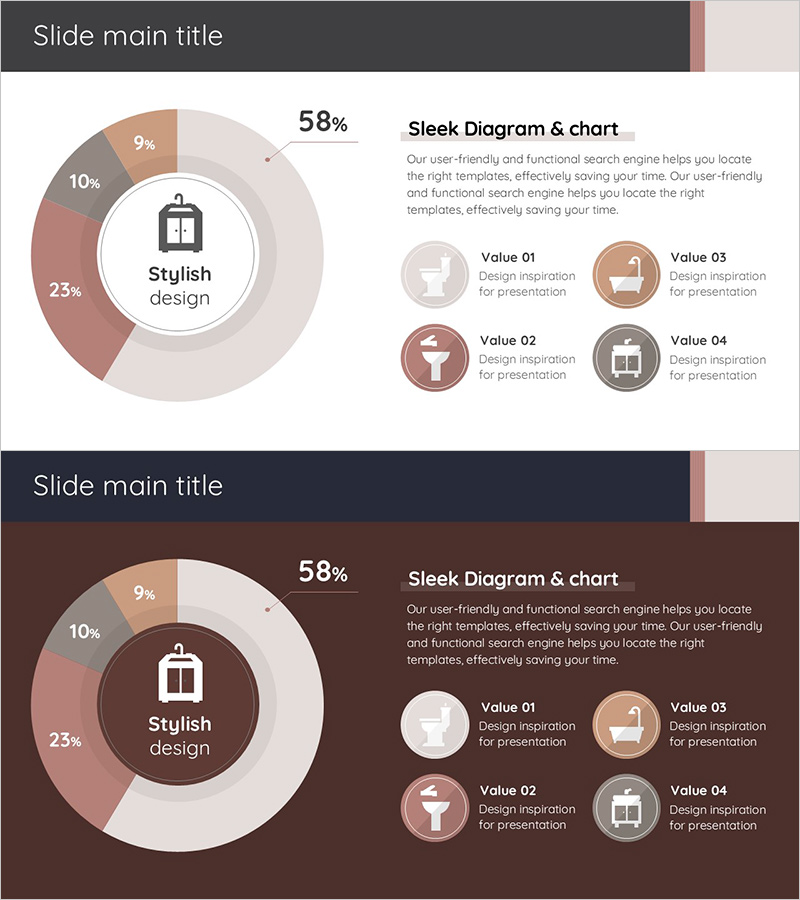
A professional PowerPoint slide featuring a doughnut chart to visualize bathroom remodeling market research data with four distinct segments. The design combines a central icon with clear percentage labels (9%, 10%, 23%, 58%) and a harmonious color palette of beige, brown, and gray tones. This 2-slide presentation template enables effective communication of market analysis and consumer preference data, with fully editable elements in standard PPTX format for immediate customization.
Usage Points
-
Main Usage
Effectively communicate market research and consumer survey results through a doughnut chart that clearly displays proportional relationships and compositional analysis. The central icon area allows emphasis of key messages or category names, enhancing data interpretation clarity.
-
How to Use
Apply to market analysis, business reports, and marketing strategy presentations in sections covering market share, customer satisfaction, and preference surveys. Edit segment values and labels with actual data, and customize the central icon to specify the survey topic.
-
Recommended For
Market researchers, marketing strategists, business executives, management consultants, and research professionals presenting consumer survey findings, market share distribution, and customer segmentation data.
-
Slide Structure
Two-slide template with the first slide featuring a light background, 4-segment doughnut chart with percentages (9%, 10%, 23%, 58%), centered icon, and four descriptive value boxes on the right. The second slide provides a dark background version with identical layout for flexible theme matching.
Related Products
-

Visualizing Fish Market Share with Doughnut Chart – Vitality of the Ocean
#Market and Competitor Analysis #Graph #Market Status
-

Management System Donut Chart Slide – Market Share and Status
#Market and Competitor Analysis #Graph #Market Status
-

Market Share Analysis Graph by Technology – Competition and Collaboration
#Market and Competitor Analysis #Diagram #Graph
-

Marking Milestones with Market Data – Market Status and Share
#Market and Competitor Analysis #Graph #Market Status
