Estimated Income Report Table – Clarity in Financial Planning
RM0100001_32
- Last Update 01/24/2025
- File Size 2MB
- # of Slides 2
- File Format PPTX
- Slide Ratio 16:9
- Color
Keywords
- #Content-Based Slides
- #Design-Based Slides
- #Financial Plans and Performance
- #Diagram
- #Income Statement
- #Key Financial Indicators
- #Table
- #16:9
- #estimated income statement PowerPoint
- #financial data table slide
- #income projection template PPT
- #revenue forecast slide
- #how to create financial tables in PowerPoint
About the Product
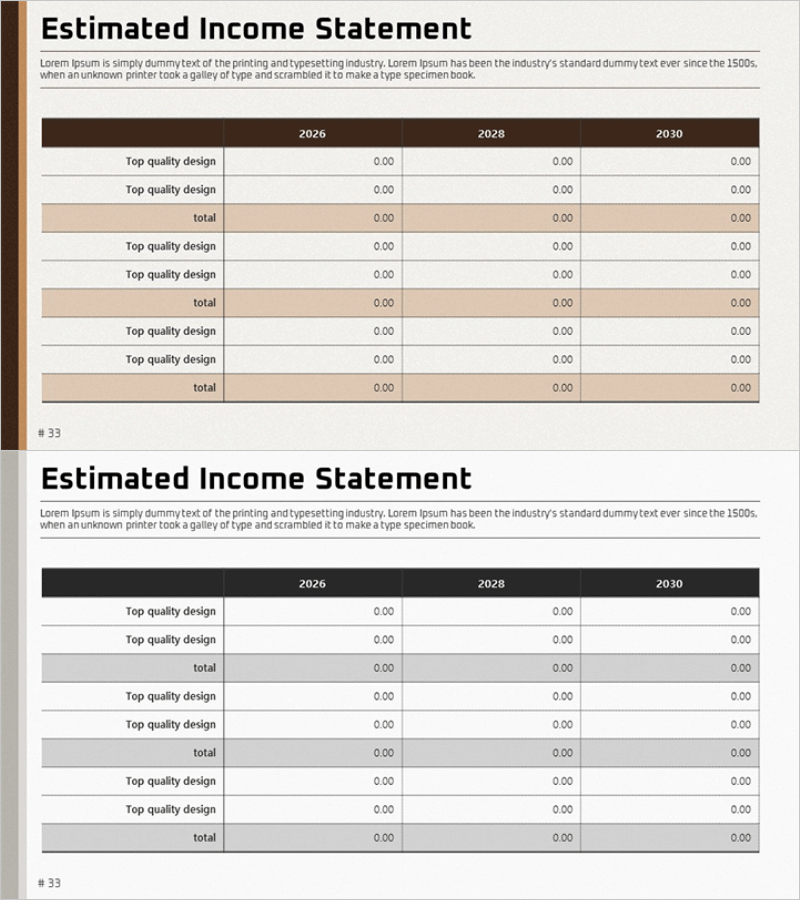
An essential financial planning PowerPoint slide for presenting estimated income statements and investment analysis. This 2-slide deck visualizes multi-year financial data from 2026 through 2030 in a structured table format. The slides feature brown, gray, and beige header tones with clear row-and-column layouts that effectively communicate numerical information. Each slide includes a descriptive text area at the top and a comprehensive data table below, allowing you to compare financial metrics, return on investment, budget status, and revenue projections at a glance. Delivered in 16:9 widescreen PPTX format, fully editable and ready to integrate into business plans, investor presentations, and financial reports.
Usage Points
-
Main Usage
This slide systematically visualizes corporate financial forecasts and income projections. By organizing annual financial metrics in a structured row-and-column table, it clearly communicates financial health and profitability to investors, executives, and stakeholders. Multi-year comparisons enable viewers to quickly assess growth trends and financial stability.
-
How to Use
Insert this slide into the financial section of business plans, financial outlook portions of investor presentations, or profitability analysis segments of investment proposals. Replace the table row labels (item names) and column data (year-by-year figures) with your own financial information. Use the color-coded headers (brown and gray) to emphasize key metrics, and add analytical commentary in the text area to explain the significance of the numbers.
-
Recommended For
CFOs, financial managers, business planners, investment officers, and startup founders presenting financial projections. Ideal for bank loan applications, venture capital fundraising pitches, shareholder reports, and business expansion presentations where financial credibility is paramount.
-
Slide Structure
Each slide consists of a title and descriptive text area at the top (approximately 100px) and a data table section below. The table features a left column for item names (4–5 rows such as 'Top quality design') and three right columns for fiscal years (2026, 2028, 2030). Each cell contains numerical data in 0.00 format. Alternating row groups use brown, gray, and beige backgrounds to enhance readability and visual hierarchy.
Related Products
-

Learning Illustrations and Table Charts – Visualizing Financial Performance
#Financial Plans and Performance #Diagram #Income Statement
-

Income Statement Table – Clearly Presenting Financial Plans and Performance
#Financial Plans and Performance #Diagram #Income Statement
-

Robot Business Revenue and Sales Analysis Table – A Systematic Approach to Financial Planning
#Financial Plans and Performance #Diagram #Income Statement
-

Income Statement Table - Clear and Professional Data
#Financial Plans and Performance #Diagram #Income Statement
