Fire Department Work Table – Visualizing Financial Plans and Performance
RJ0600044_16
- Last Update 07/02/2025
- File Size 7.1MB
- # of Slides 2
- File Format PPTX
- Slide Ratio 16:9
- Color
Keywords
- #Content-Based Slides
- #Design-Based Slides
- #Financial Plans and Performance
- #Diagram
- #Income Statement
- #Key Financial Indicators
- #Table
- #16:9
- #financial data table PowerPoint slide
- #comparison table design
- #budget presentation slide
- #how to create financial tables in PowerPoint
- #performance metrics slide template
About the Product
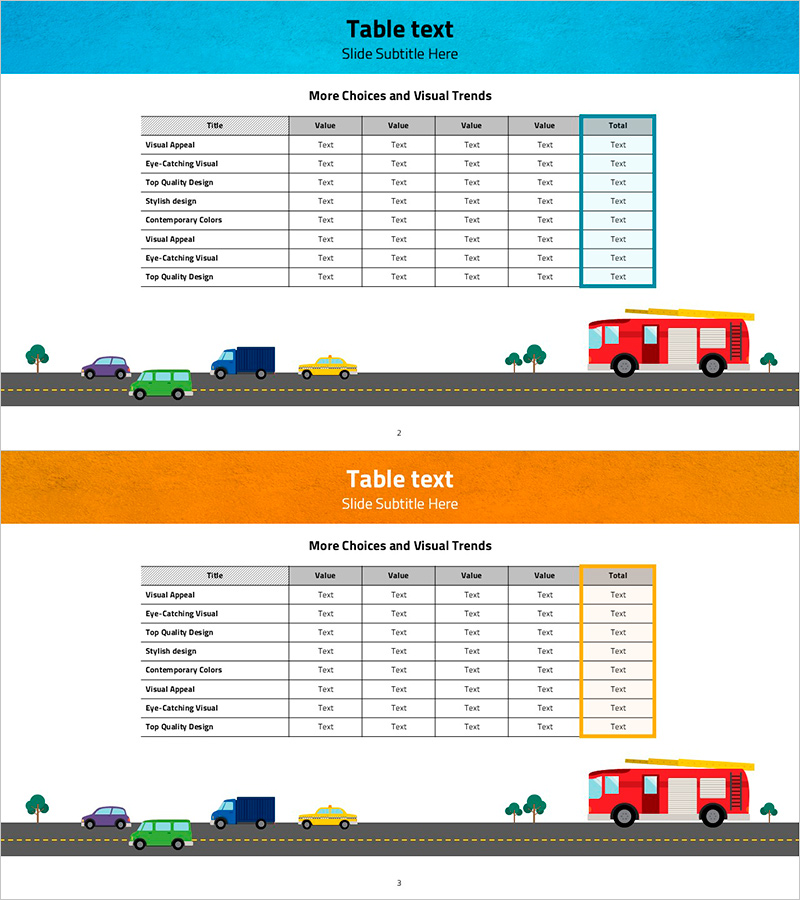
A professional financial data table PowerPoint slide designed to compare financial plans and performance metrics at a glance. This 2-slide set features two distinct color schemes—teal and orange headers—making it ideal for presenting budget data, income statements, and performance indicators. Each slide includes a 5-column data entry structure with a highlighted Total column for emphasis. Fully editable in PowerPoint, this template is optimized for financial reports, government agencies, fire departments, and corporate presentations requiring clear numerical visualization.
Usage Points
-
Main Usage
Visualize financial data, budget allocations, income statements, and performance metrics in a structured table format. The teal and orange headers clearly distinguish information hierarchy, while the Total column emphasizes key figures for decision-making support.
-
How to Use
Use in investor presentations, financial reports, budget review meetings, and performance evaluation presentations. Simply input row labels and numerical values across the five columns; colors and fonts can be adjusted to match your existing presentation template.
-
Recommended For
CFOs, financial analysts, government agency managers, fire department budget officers, and corporate executives preparing financial reports. Ideal for any presentation requiring accurate financial data comparison and analysis.
-
Slide Structure
2-slide set. Each slide contains a title area (Table text), subtitle (Slide Subtitle Here), a 5-column × 8-row data table (Title, Value columns, and Total), and footer illustration (road scene with vehicles and fire truck). All table cells are fully editable, with color-highlighted columns to emphasize critical information.
Related Products
-

Financial Performance Analysis Table Slide – Data Visualization for Growth
#Financial Plans and Performance #Diagram #Income Statement
-

Income Statement Table – Clearly Presenting Financial Plans and Performance
#Financial Plans and Performance #Diagram #Income Statement
-

Income Statement Table Slide – Clear Financial Analysis
#Financial Plans and Performance #Diagram #Income Statement
-

Space Illustration Theme Chart – Income Statement and Key Financial Metrics
#Financial Plans and Performance #Diagram #Income Statement
