Sea Lighthouse Key Financial Indicators Table
RJ0600079_28
- Last Update 07/11/2025
- File Size 5.7MB
- # of Slides 2
- File Format PPTX
- Slide Ratio 16:9
- Color
Keywords
- #Content-Based Slides
- #Design-Based Slides
- #Financial Plans and Performance
- #Diagram
- #Income Statement
- #Key Financial Indicators
- #Table
- #16:9
- #financial indicators table PowerPoint
- #financial data presentation slide
- #income statement table design
- #financial ratio analysis slide
- #multi-row data table PPT
About the Product
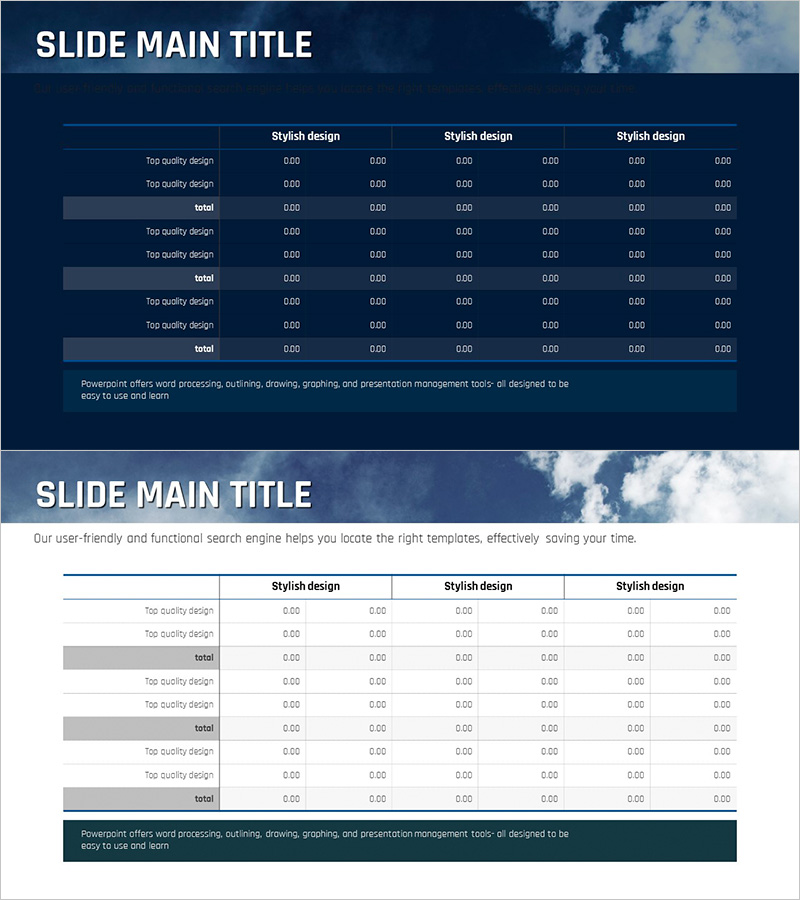
A financial indicators table PowerPoint slide with a sea lighthouse color theme. The design features a dark blue background with white text and gray row dividers that maximize data readability. The 6-column, multi-row structure is ideal for presenting complex financial information such as income statements, key financial metrics, and financial ratio analysis. Each row is clearly categorized, and subtotal rows use emphasized backgrounds to create visual hierarchy. This presentation slide effectively communicates financial data in investment presentations, financial reports, and business plans.
Usage Points
-
Main Usage
Optimized for organizing and visualizing complex financial figures in a systematic manner. Presents income statements, financial metrics, and ratio analysis in a clear table format to support decision-making with reliable financial data.
-
How to Use
Use in investor relations (IR) financial sections, business plan financial planning sections, quarterly and annual financial reports, and financial analysis presentations. Edit row text and numerical values to input actual financial data for your organization.
-
Recommended For
CFOs, finance managers, investor relations teams, and executives presenting financial performance and metrics. Suitable for financial institutions, startup fundraising pitches, corporate internal reporting, and presentations where financial credibility is essential.
-
Slide Structure
Comprises a title area, 6-column header row (stylish design labels), 3 sections with multiple data rows (2-3 rows per section plus subtotal row), and a footer text area. Each section is visually separated by gray-background subtotal rows, creating clear information hierarchy.
Related Products
-

Learning Illustrations and Table Charts – Visualizing Financial Performance
#Financial Plans and Performance #Diagram #Income Statement
-

Income Statement Table – Clearly Presenting Financial Plans and Performance
#Financial Plans and Performance #Diagram #Income Statement
-

Income Statement Table - Clear and Professional Data
#Financial Plans and Performance #Diagram #Income Statement
-

Key Financial Indicators Table – Trust and Professionalism
#Financial Plans and Performance #Diagram #Income Statement
