Balance Sheet by Year Template – Data Visualization for Financial Performance Enhancement
RM0100001_31
- Last Update 01/24/2025
- File Size 2MB
- # of Slides 2
- File Format PPTX
- Slide Ratio 16:9
- Color
Keywords
- #Content-Based Slides
- #Design-Based Slides
- #Financial Plans and Performance
- #Diagram
- #Balance Sheet
- #Sales and Revenue
- #Table
- #16:9
- #balance sheet PowerPoint slide
- #financial table template
- #year-over-year financial comparison
- #financial performance table design
- #how to create a balance sheet in PowerPoint
About the Product
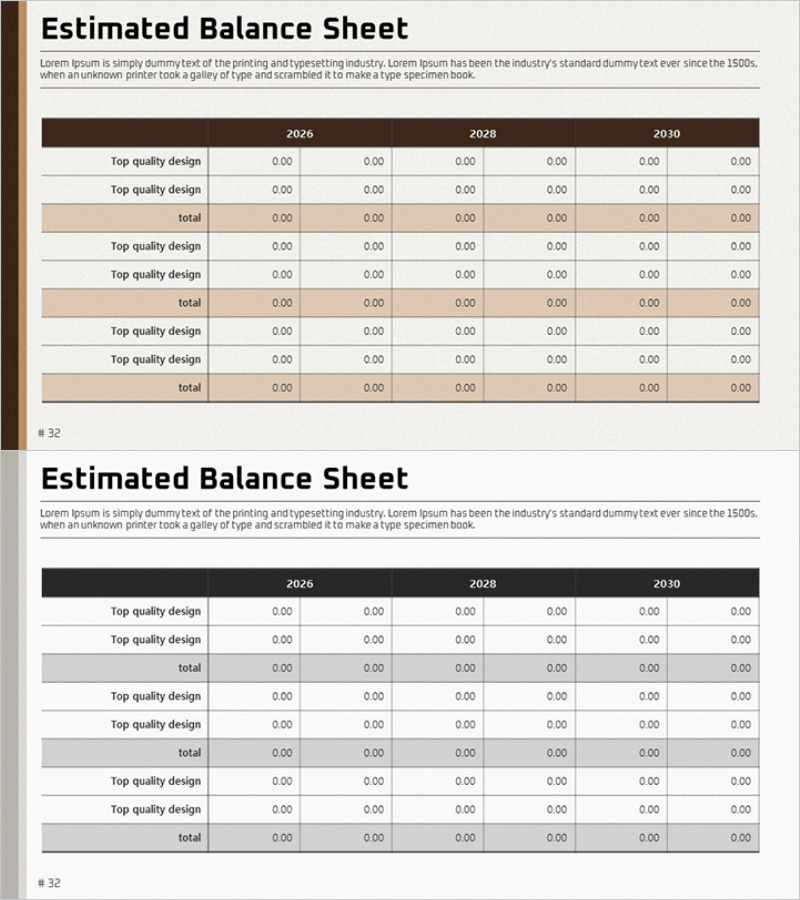
A professional balance sheet PowerPoint slide designed to clearly present financial performance across multiple years. This template features a structured table layout comparing financial data for 2026, 2028, and 2030 in a single view. The brown header and beige background color scheme reinforces financial credibility and data integrity. Each row and column is clearly defined for easy data entry, making it ideal for investor presentations, business plans, and financial reports. The 16:9 widescreen format includes 2 fully editable slides with customizable text and numerical fields for immediate use in corporate presentations.
Usage Points
-
Main Usage
This slide systematically visualizes corporate financial position and enables stakeholders to analyze financial trends across multiple years. The structured table format displays assets, liabilities, and equity items by year, allowing investors, financial institutions, and executives to quickly assess financial health and performance trajectory.
-
How to Use
Use this slide in the financial overview section of investor presentations, the financial projections page of business plans, or as a key metrics summary in annual financial reports. Simply input actual figures into each cell for immediate presentation use. Colors and fonts can be customized to match your corporate brand guidelines and design standards.
-
Recommended For
CFOs, financial managers, executives, and investor relations professionals presenting financial performance. Ideal for startup fundraising pitches, public company quarterly earnings presentations, consulting firm financial analysis reports, and any presentation requiring data-driven financial decision-making and stakeholder communication.
-
Slide Structure
The 2-slide template features a table layout with 3 years (2026, 2028, 2030) displayed across 6 columns. The brown header row shows year labels, the left column lists financial line items (assets, liabilities, equity, etc.), and the center data area contains 18 editable cells for numerical input, providing comprehensive financial data visualization.
Related Products
-

Colored Pencil Highlight Table Chart – Visualizing Financial Performance
#Financial Plans and Performance #Diagram #Balance Sheet
-

Create Financial Plans with a Simple Sky Table
#Financial Plans and Performance #Diagram #Balance Sheet
-

Brown Table Design for Financial Planning Slide
#Financial Plans and Performance #Diagram #Balance Sheet
-

Business Sales and Profit Calculation Table – Essential Slide for Financial Planning
#Financial Plans and Performance #Diagram #Income Statement
