Brown Table Design for Financial Planning Slide
RJ0900009_27
- Last Update 08/18/2025
- File Size 0.1MB
- # of Slides 2
- File Format PPTX
- Slide Ratio 16:9
- Color
Keywords
About the Product
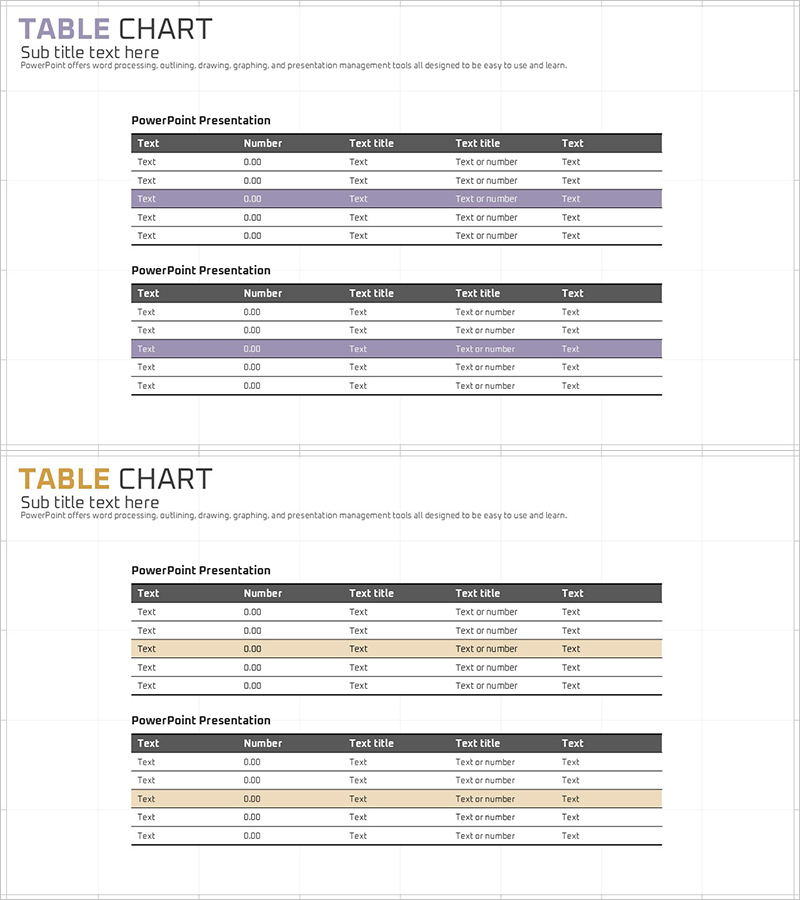
A professional table PowerPoint slide designed for presenting financial data, budget analysis, and financial metrics with clarity and precision. The slide features a two-tone header in purple and brown colors that emphasizes data categorization, with a 5-row by 5-column layout accommodating numbers, text, percentages, and other financial information. The 2-slide set allows for repeated use of the same layout or comparative analysis, optimized for 16:9 widescreen format. Provided in editable PPTX format, it integrates seamlessly into corporate presentations, investor briefings, financial reports, and budget planning documents.
Usage Points
-
Main Usage
Visualize financial data, budget status, financial metrics, and income statement items in a clear tabular format. The purple-brown header row distinguishes data categories, while alternating row colors enhance readability and data comprehension.
-
How to Use
Apply this slide in financial reports, investor presentations, and business plan documents within the financial section. Input numbers, text, and percentages directly to display budget comparisons, year-over-year trends, departmental performance, and other financial metrics. Stack both slides consecutively to present multiple tables or repeat data structures.
-
Recommended For
Finance teams, executives, CFOs, and investor relations professionals presenting financial status, budget plans, and performance analysis. Ideal for corporate meetings, shareholder meetings, bank loan presentations, and investment pitch decks where data-driven decision-making is essential.
-
Slide Structure
Each slide contains a title area and a 5-row by 5-column data table. The header row uses a purple-brown two-tone design for distinction, while data rows alternate between white and light colors for clear row-level separation. Both slides maintain identical layouts for consistent data presentation across multiple tables.
Related Products
-

Colored Pencil Highlight Table Chart – Visualizing Financial Performance
#Financial Plans and Performance #Diagram #Balance Sheet
-

Create Financial Plans with a Simple Sky Table
#Financial Plans and Performance #Diagram #Balance Sheet
-

Balance Sheet by Year Template – Data Visualization for Financial Performance Enhancement
#Financial Plans and Performance #Diagram #Balance Sheet
-

Sales and Profit Calculation Table – Efficient Profit Management
#Financial Plans and Performance #Diagram #Income Statement
