Colored Pencil Highlight Table Chart – Visualizing Financial Performance
RJ0500015_15
- Last Update 06/11/2025
- File Size 5.7MB
- # of Slides 2
- File Format PPTX
- Slide Ratio 16:9
- Color
Keywords
About the Product
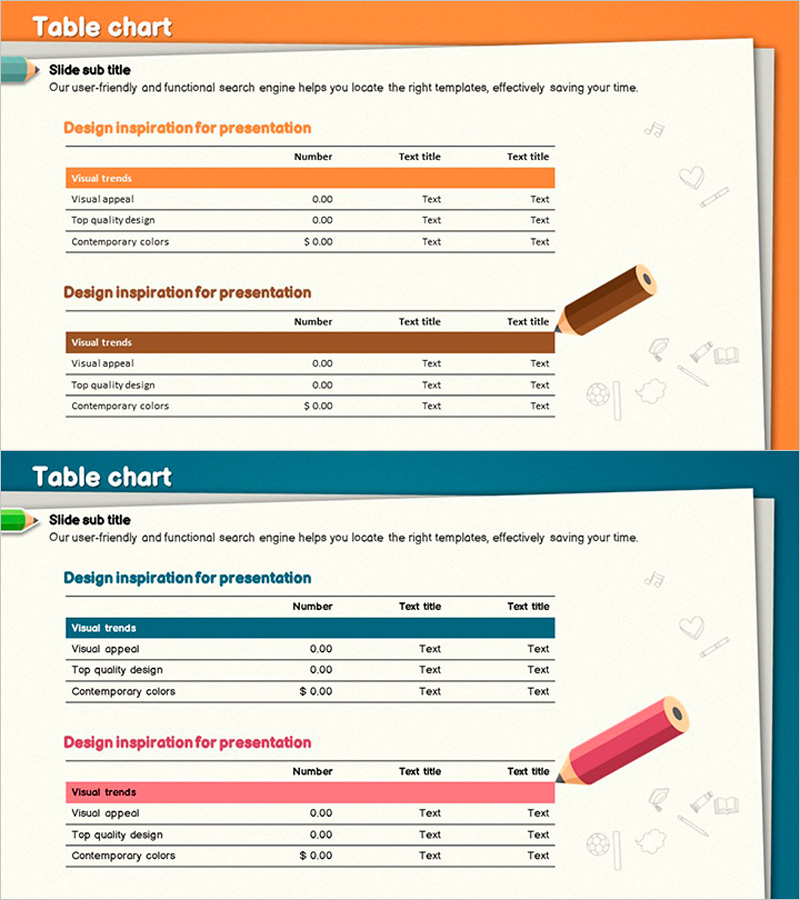
A 4-row table chart PowerPoint slide designed to present financial performance and key metrics with clarity and visual impact. Features orange and brown colored pencil highlight headers that establish visual hierarchy, with efficient placement of numbers, text labels, and category names. The 2-slide set enables side-by-side comparison of multiple data sets and is immediately applicable to financial presentations including revenue, performance, balance sheets, and budgets. Optimized for 16:9 widescreen format in PPTX, allowing seamless editing and customization of colors and text content.
Usage Points
-
Main Usage
Presents numerical data such as financial performance, revenue, budgets, and balance sheets in an organized table format to facilitate comparative analysis. Orange and brown colored pencil header design visually emphasizes key items and directs audience attention to critical information.
-
How to Use
Apply to financial reports, quarterly performance presentations, investor briefings, and business plan financial sections. Customize by entering existing data into table cells or modifying colors to align with corporate branding. The 2-slide format allows sequential presentation of multiple data sets.
-
Recommended For
Recommended for CFOs, finance managers, executives, and investor relations professionals presenting financial performance persuasively. Supports data-driven decision-making during quarterly earnings presentations, annual financial reports, and budget planning phases.
-
Slide Structure
2-slide set with each slide containing a 4-row (Visual trends, Visual appeal, Top quality design, Contemporary colors) × 3-column (Number, Text title, Text title) table. Header rows feature orange or brown backgrounds with white text, while data rows use white backgrounds for clear visual separation.
Related Products
-

Create Financial Plans with a Simple Sky Table
#Financial Plans and Performance #Diagram #Balance Sheet
-

Hologram Wide PPT Table & Segmentation Bar Graph – Trendy Data Visualization
#Market and Competitor Analysis #Financial Plans and Performance #Diagram
-

Sales and Profit Calculation Table – Key to Profit Management
#Financial Plans and Performance #Diagram #Income Statement
-

Simple PPT Wide Template Vertical Bar & Table
#Financial Plans and Performance #Diagram #Graph
