Chair Sales Graph – Visual Data Analysis
RJ0900027_11
- Last Update 08/24/2025
- File Size 0.3MB
- # of Slides 2
- File Format PPTX
- Slide Ratio 16:9
- Color
Keywords
- #Content-Based Slides
- #Design-Based Slides
- #Market and Competitor Analysis
- #Financial Plans and Performance
- #Graph
- #Competitive Advantage
- #Sales and Revenue
- #Line
- #Line Chart
- #16:9
- #line chart PowerPoint slide
- #dual-series trend analysis
- #data visualization template
- #sales performance graph
- #how to create line chart in PowerPoint
About the Product
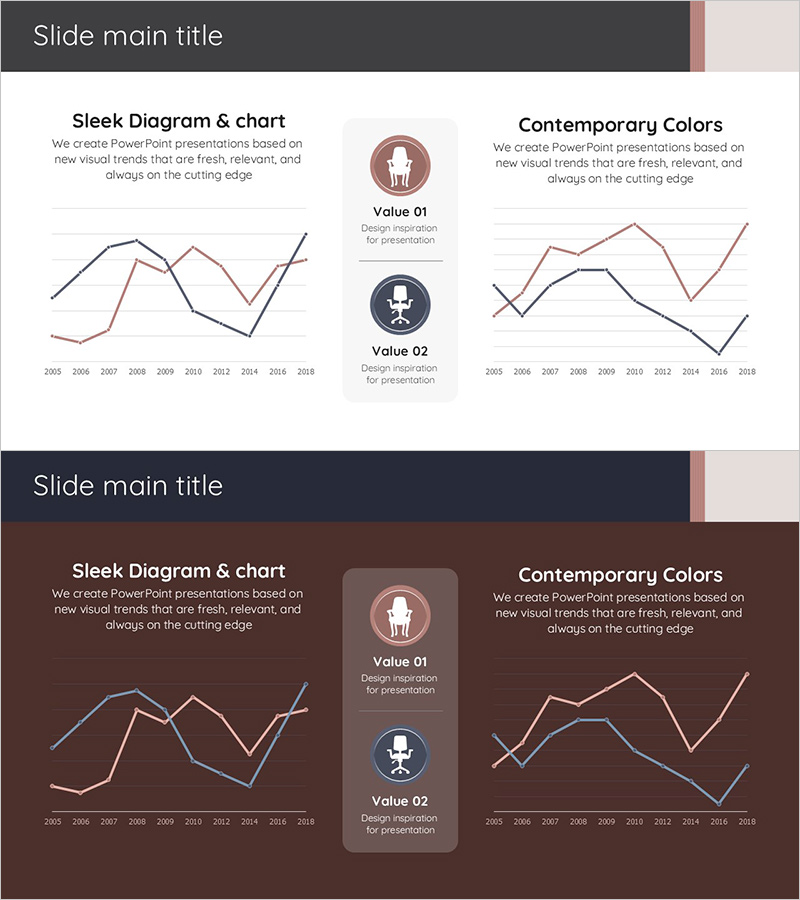
A dual-series line chart PowerPoint slide designed to compare data trends over time from 2005 to 2018. The slide features black and brown line series on a minimalist gray, beige, and brown-toned background, with circular value icons emphasizing key metrics. This chart template is optimized for sales performance, market analysis, and competitive positioning comparisons. The 2-slide set includes variations with different background colors while maintaining consistent data visualization structure. Ready to download and customize for presentations, reports, and business proposals.
Usage Points
-
Main Usage
Visualize and compare two or more data series over time to identify trends, patterns, and performance changes. Ideal for presenting sales growth, market share evolution, competitive benchmarking, and quarterly performance metrics in a clear, comparative format.
-
How to Use
Insert into financial reports for performance analysis sections, marketing presentations for market trend analysis, business plans for forecasting data, and quarterly earnings presentations. Edit the data values, axis labels, and legend text to match your specific dataset while maintaining the professional chart design.
-
Recommended For
Finance teams, marketing analysts, executives, management consultants, and business strategists presenting data-driven insights. Use for quarterly earnings reports, market trend analysis, competitive positioning, and strategic growth planning presentations.
-
Slide Structure
2-slide set with dual-series line charts. Each slide displays two data series (black and brown lines) spanning 2005-2018, circular value icons (Value 01, Value 02) in the center, left-aligned title and description text, and background color variations (gray, beige, brown tones) for visual differentiation.
Related Products
-

Competitor Market Analysis Graph – Financial Performance and Competitive Advantage
#Market and Competitor Analysis #Financial Plans and Performance #Diagram
-

Sales and Net Income Graph – Visualizing Business Performance
#Market and Competitor Analysis #Financial Plans and Performance #Graph
-

Sales Trend by Division – Performance Insights
#Market and Competitor Analysis #Financial Plans and Performance #Graph
-

Graph Slide Visualizing Average Monthly Eating Out Consumption Trends
#Market and Competitor Analysis #Financial Plans and Performance #Graph
