Line Graph Analysis of Textile Market – Gain Competitive Edge
RB0800023_13
- Last Update 03/22/2025
- File Size 7.4MB
- # of Slides 2
- File Format PPTX
- Slide Ratio 4:3
- Color
Keywords
- #Content-Based Slides
- #Design-Based Slides
- #Market and Competitor Analysis
- #Financial Plans and Performance
- #Graph
- #Competitive Advantage
- #Sales and Revenue
- #Line
- #Line Chart
- #4:3
- #line graph PowerPoint
- #dual-series line chart slide
- #market analysis PowerPoint
- #trend analysis presentation
- #competitive advantage slide
- #data visualization template
About the Product
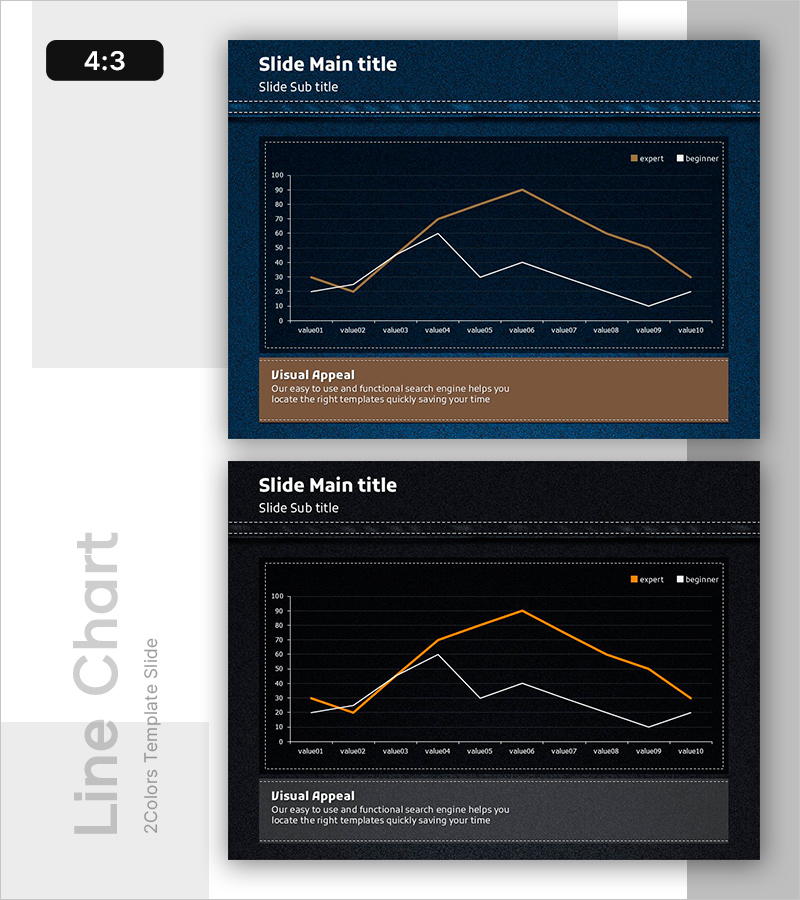
A professional dual-series line graph PowerPoint slide visualizing textile market trends and competitive advantage. The dark blue background features orange and white lines representing Expert and Beginner performance across 10 data points. Grid background and legend are included for easy data interpretation. This presentation slide is ready to use for market analysis, financial performance comparison, and competitive positioning reports. The 4:3 aspect ratio with 2-slide layout integrates seamlessly into business presentations and reports.
Usage Points
-
Main Usage
Visualize and compare performance trends between two groups (Expert and Beginner) in the textile market across 10 data points. The line graph clearly illustrates trajectory changes over time, demonstrating competitive advantage and market positioning through data-driven insights.
-
How to Use
Use in market analysis, financial performance reporting, and competitive analysis presentations. Replace the placeholder data values (value01–value10) and legend labels (Expert·Beginner) with actual figures. The dark blue professional tone suits executive briefings and B2B presentations. Fully editable in PowerPoint for custom data integration.
-
Recommended For
Marketing managers, financial analysts, executives, consultants, and market research professionals presenting competitive analysis, performance benchmarking, and trend forecasting. Ideal for textile, fashion, and consumer goods industries conducting market assessment and strategic planning presentations.
-
Slide Structure
2-slide set with dark blue background featuring title and subtitle areas, central dual-series line graph (2 data series, 10 points each), legend in upper right (orange Expert line, white Beginner line), and Visual Appeal description box at bottom. Grid background enables precise data value reading. 4:3 aspect ratio ensures standard projector compatibility.
Related Products
-

Rising Section Blue Line Chart - Sales and Revenue Analysis
#Market and Competitor Analysis #Financial Plans and Performance #Graph
-

Product-wise Vertical Bar Chart and Analysis - Market and Competitive Analysis
#Market and Competitor Analysis #Financial Plans and Performance #Graph
-

Slide Visualizing Sales Performance Trend in the Kids Market
#Market and Competitor Analysis #Financial Plans and Performance #Graph
-

Chair Sales Graph – Visual Data Analysis
#Market and Competitor Analysis #Financial Plans and Performance #Graph
