Graph Analysis by Year Sales
RJ0900029_18
- Last Update 08/25/2025
- File Size 1.9MB
- # of Slides 2
- File Format PPTX
- Slide Ratio 16:9
- Color
Keywords
- #Content-Based Slides
- #Design-Based Slides
- #Market and Competitor Analysis
- #Financial Plans and Performance
- #Graph
- #Competitive Advantage
- #Sales and Revenue
- #Line
- #Line Chart
- #16:9
- #line chart PowerPoint slide
- #sales trend analysis presentation
- #multi-series data visualization
- #financial performance PPT
- #year-over-year sales chart template
About the Product
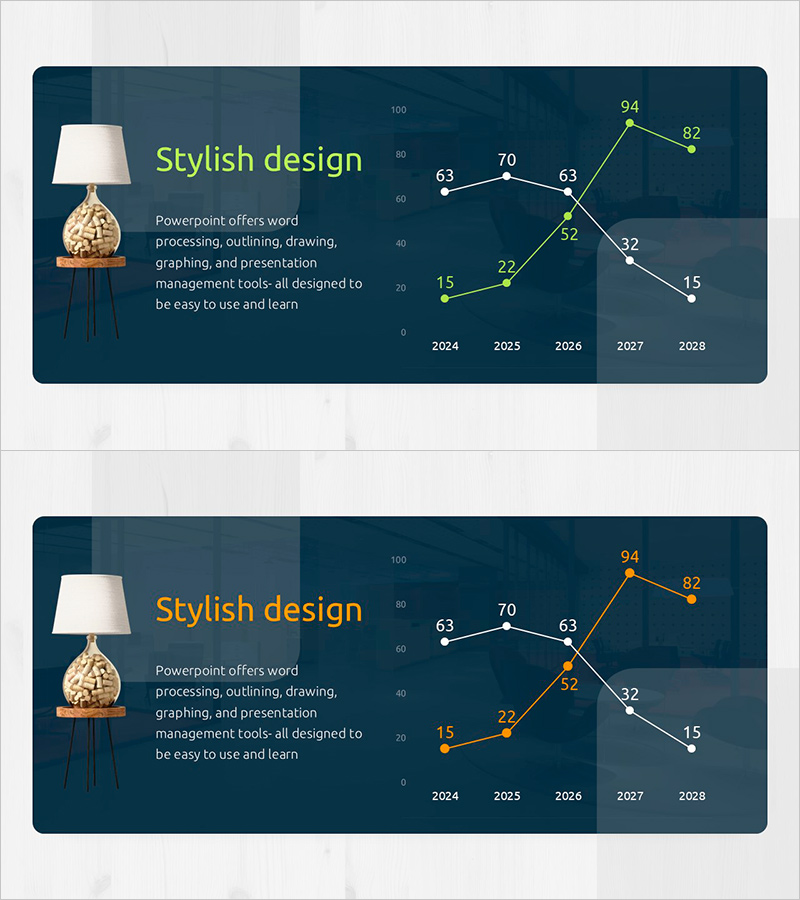
A professional line chart PowerPoint slide that visualizes year-over-year sales performance from 2024 to 2028 across five data points. The slide features three distinct data series (lime, orange, and white) plotted against a dark blue background with clear numerical labels at each data point. The left side includes a stylish lamp illustration paired with descriptive text, enhancing the credibility of your presentation. This 2-slide template is ready for immediate use in financial reports, quarterly earnings presentations, investor relations meetings, and business performance reviews.
Usage Points
-
Main Usage
Clearly visualize five years of sales performance trends using a multi-series line chart that enables stakeholders to identify growth patterns, seasonal variations, and comparative performance across different product lines or business units at a glance.
-
How to Use
Ideal for financial reports, quarterly earnings calls, investor presentations, and executive briefings. Simply replace the sample data points with your actual sales figures and adjust the series labels to match your business segments. You can easily add or remove data series by modifying the chart structure to accommodate additional comparison metrics.
-
Recommended For
CFOs, financial analysts, business development managers, sales directors, and executive teams presenting quarterly or annual performance results. Also suitable for consulting firms presenting client analysis, startups pitching to investors, and academic researchers demonstrating longitudinal data trends.
-
Slide Structure
Two-slide template with dark blue background and centered line chart. The first slide displays three data series (lime, orange, white) with data points at 15, 22, 63, 70, 63, 52, 32, 94, 82, and 15 across the 2024-2028 timeline. The left panel includes a decorative lamp illustration, 'Stylish design' heading, and explanatory text. The second slide mirrors the chart structure with alternative color schemes to support different data scenarios and presentation contexts.
Related Products
-

Garden Management Curve Graph
#Market and Competitor Analysis #Financial Plans and Performance #Graph
-

Sales and Net Income Graph – Visualizing Business Performance
#Market and Competitor Analysis #Financial Plans and Performance #Graph
-

Rising Section Blue Line Chart - Sales and Revenue Analysis
#Market and Competitor Analysis #Financial Plans and Performance #Graph
-

Graph Slide Visualizing Average Monthly Eating Out Consumption Trends
#Market and Competitor Analysis #Financial Plans and Performance #Graph
