Comparison Bar Graph – Market and Competitor Analysis
RJ0900026_18
- Last Update 08/23/2025
- File Size 1.6MB
- # of Slides 2
- File Format PPTX
- Slide Ratio 16:9
- Color
Keywords
About the Product
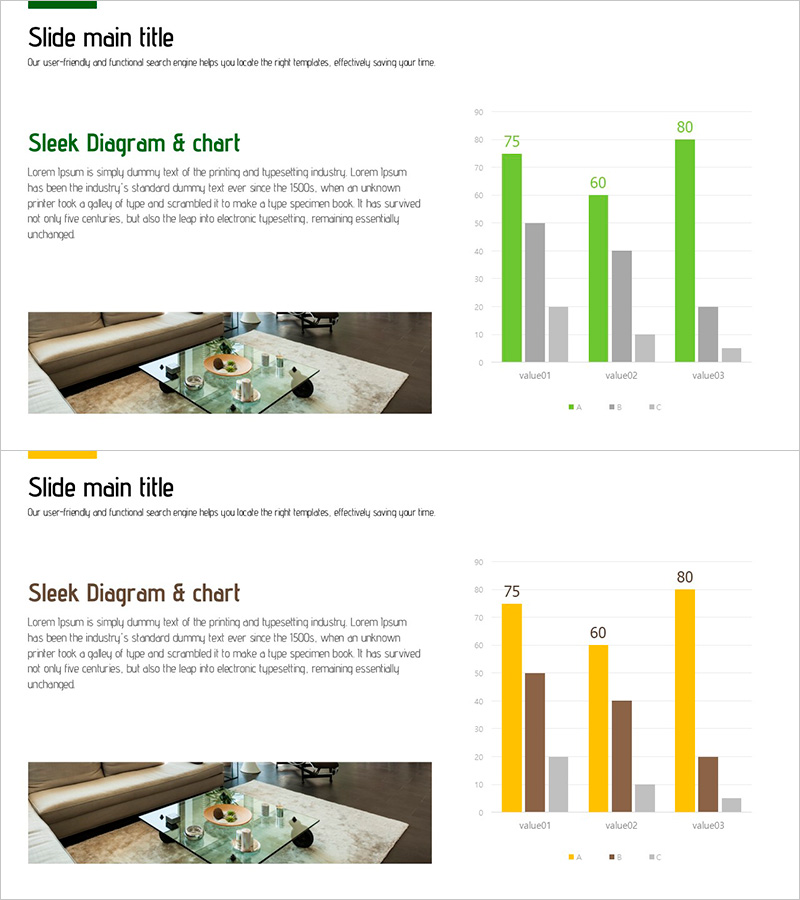
A horizontal bar chart PowerPoint slide optimized for market analysis and competitor comparison. This presentation template features a grouped bar chart with three data series in green, yellow, and brown, enabling simultaneous comparison of up to three metrics across multiple items. Each slide layout divides the space between a left text area for descriptions and a right chart area for data visualization. The 16:9 widescreen format includes 2 slides ready for immediate editing and integration into your business presentations.
Usage Points
-
Main Usage
Displays numerical data comparison across three metrics or categories, such as market size, competitor performance, or product benchmarking. The horizontal bar format clearly labels items and enables intuitive value comparison, making it ideal for reports, proposals, and strategic presentations.
-
How to Use
Enter your analysis title and description in the left text area, then update the bar lengths and values in the chart section with your actual data. The color series can be retained or customized as needed, and the legend labels (A, B, C) can be replaced with your metric names for immediate use.
-
Recommended For
Marketing professionals, strategy planners, and executives presenting market analysis, competitive positioning, or product performance comparisons. Suitable for business plans, marketing strategy documents, quarterly performance reports, and investor pitch decks.
-
Slide Structure
2-slide set. Each slide features a left text area (for title and description input) and a right horizontal bar chart area. The chart displays 3 data series (green, yellow, brown) in grouped format across 3 items (value01, value02, value03), with each item showing 3 data points.
Related Products
-

Comparative Chart Analysis – Optimized for Market and Competitive Analysis
#Market and Competitor Analysis #Graph #Market Analysis
-

Marketing Performance Analysis Chart by Year – Visualizing Market Trends
#Market and Competitor Analysis #Diagram #Graph
-

Infographic Slide Highlighting Visualized Data – Modern Design
#Market and Competitor Analysis #Graph #Competitor Analysis
-

Vertical Bar Chart for Future Growth Prediction – Innovative Vision
#Market and Competitor Analysis #Graph #Competitor Analysis
