Regional Competitive Advantage Chart – Essential Tool for Market and Competitor Analysis
RJ0600011_18
- Last Update 06/23/2025
- File Size 1.2MB
- # of Slides 2
- File Format PPTX
- Slide Ratio 16:9
- Color
Keywords
- #Content-Based Slides
- #Design-Based Slides
- #Company Introduction
- #Market and Competitor Analysis
- #Graph
- #Other
- #Domestic Network
- #Market Analysis
- #Column
- #Grouped Column
- #16:9
- #regional competitive advantage chart
- #US map PowerPoint slide
- #market analysis PPT
- #regional comparison graph
- #competitive analysis presentation
About the Product
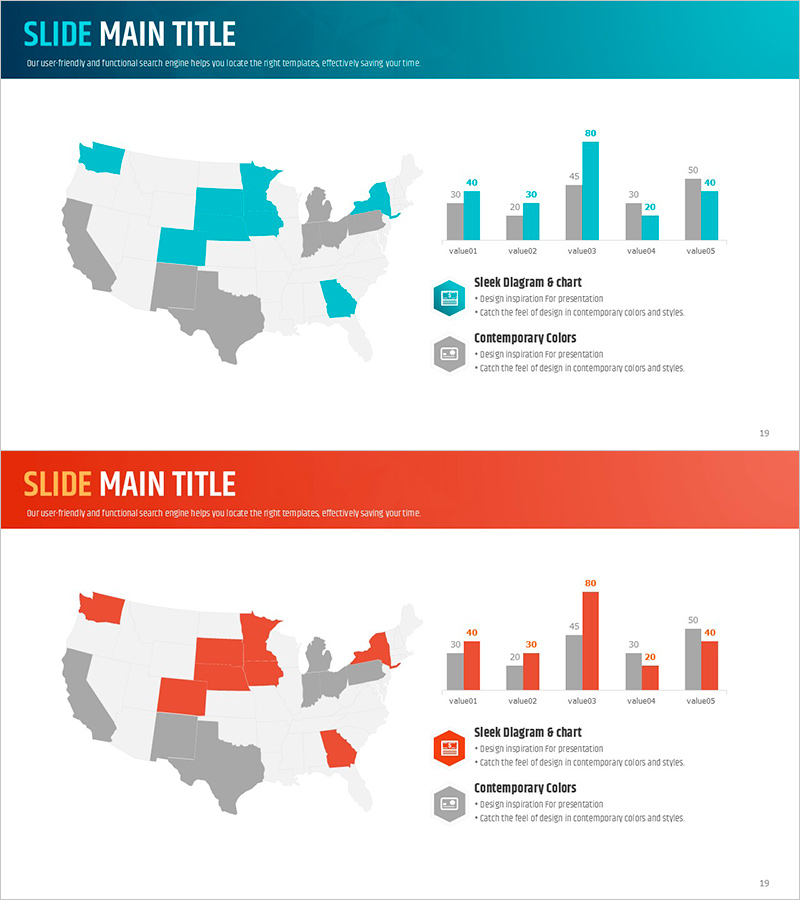
A PowerPoint slide set that visualizes regional competitive advantages across the United States. The template features a US map with five regions color-coded for easy identification, paired with horizontal bar charts displaying competitive metrics for each region. Available in two color themes—teal and orange—this presentation tool effectively communicates regional market strengths during strategic planning and competitive analysis discussions. The set includes 2 slides in 16:9 widescreen format, fully editable in PPTX format for immediate customization.
Usage Points
-
Main Usage
This slide enables quick comparison of regional market competitiveness and helps prioritize regional strategy decisions. The combination of geographic visualization and numerical data clearly demonstrates competitive differences between regions, making it ideal for executive briefings and strategic planning meetings where regional expansion plans need compelling visual support.
-
How to Use
Click on regions in the map on the first slide to change colors, then double-click the bar chart values on the second slide to update with your actual data. Edit the legend and title text to match your analysis, then use the customized slides in your presentation. All elements are fully editable within PowerPoint.
-
Recommended For
Marketing strategy teams, sales managers, business development professionals, management consultants, and executives planning multi-region expansion. Particularly useful for quarterly performance reviews in multi-regional companies, market entry feasibility studies, and competitive positioning presentations across different geographic territories.
-
Slide Structure
Slide 1: US map with 5 regions color-coded in teal and gray with legend / Slide 2: Horizontal bar chart displaying the same 5 regions with dual-series data (teal and gray bars) for comparative analysis of competitive metrics.
Related Products
-

Horizontal Bar Chart Visualizing Market Sales Status
#Market and Competitor Analysis #Financial Plans and Performance #Graph
-

Show Business Activity by Region in the U.S.A – Market Analysis Presentation
#Company Introduction #Market and Competitor Analysis #Other
-

Global Area Analysis Bar Graph – Visualization of Market and Competition
#Company Introduction #Market and Competitor Analysis #Graph
-

Laptop Mockup Bar Graph – Essential Slide for Competitor Analysis
#Market and Competitor Analysis #Graph #Other
